Monitoring how much bandwidth is used is a fundamental task to check the status of your servers, or just your desktop, so i always test new tools to see if i find something good. This is the third article of this series and in this one i’ll take a look at Bmon, speedometer and Nload.
In my 2 former articles I’ve talked about:
IPTState : This software is a top-like interface to your netfilter connection-tracking table. Using iptstate you interactively watch where traffic crossing your netfilter/iptables firewall is going, sort by various criteria, limit the view by various criteria. But it doesn’t stop there: as of version 2.2.0 you can even delete states from the table!
pktstat displays a real-time list of active connections seen on a network interface, and how much bandwidth is being used. Partially decodes HTTP and FTP protocols to show what filename is being transferred. X11 application names are also shown.
NetHogs is a small ‘net top’ tool. Instead of breaking the traffic down per protocol or per subnet, like most tools do, it groups bandwidth by process. NetHogs does not rely on a special kernel module to be loaded. If there’s suddenly a lot of network traffic, you can fire up NetHogs and immediately see which PID is causing this. This makes it easy to indentify programs that have gone wild and are suddenly taking up your bandwidth.
IPTraf is a console-based network statistics utility for Linux. It gathers a variety of figures such as TCP connection packet and byte counts, interface statistics and activity indicators, TCP/UDP traffic breakdowns, and LAN station packet and byte counts.
Please note, the following 4 programs are all available in the main Ubuntu repository, so to install them just write in a terminal:
apt-get install PROGRAM-NAME |
Bmon
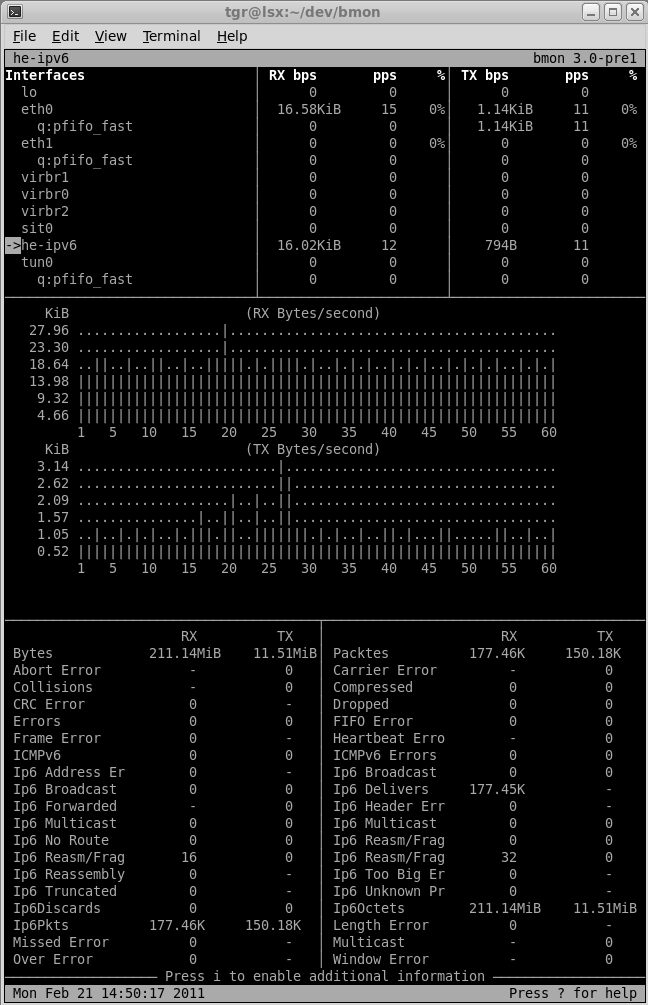
bmon is a bandwidth monitor, intended for debugging and real-time monitoring purposes, capable of retrieving statistics from various input modules. It provides various output methods including a curses based interface. A set of architecture specific input modules provide the core with the list of interfaces and their counters.
The core stores this counters and provides rate estimation including a history over the last 60 seconds, minutes, hours and days to the output modules which output them according to the configuration, when running, you can select the interface to monitor and press “g” to see an active graph like this one:
speedometer
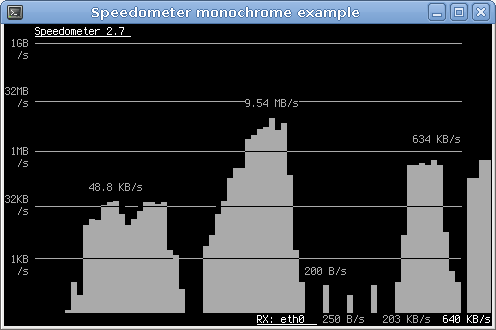
This is an interesting project that permits to display and measure the rate of data across a network connection or data being stored in a file,
As you can see, although it’s a command-line based tool, yet it has pretty vivid colors and other stuff that makes it a pretty user-friendly tool, it has the ability to monitor the current download/upload speeds of the network connections and it can be used also to measure the speed of the write to a filesystem.
Some of his features are:
- Change update intervals (default is “1″ second).
- Supports few built-in color depths (1,16-default, 88 and 256), higher numbers mean better quality outputs.
- Monitors network interfaces (upload & download) and your file system.
- Can be setup to use plain text rather than graphs.
nload
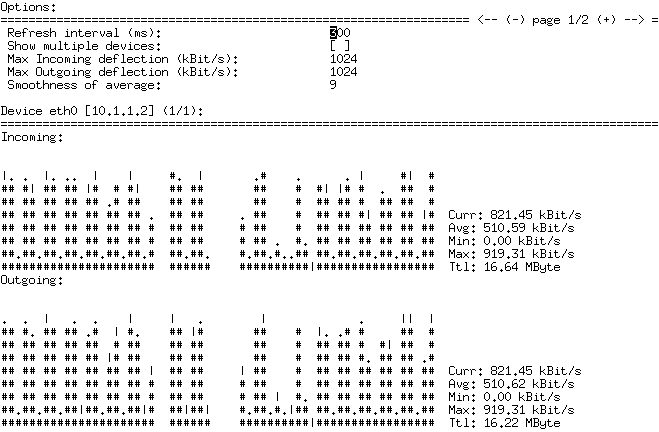
nload is a console application which monitors network traffic and bandwidth usage in real-time. It visualizes the in and outgoing traffic using two graphs and provides more info like total amount of transferred data and min/max network usage. This program uses the Ncurses libraries and so you’ll be able to interact with the mouse in the terminal.
Features of nload
- Supports all Ethernet interfaces.
- View the bandwidth with a real-time graph in the shell.
- Ability to organize the scale, the time to update the graph and the unit of measure.
Popular Posts:
- None Found


What about “iftop” ?
IPTraf is dead for a while, iptraf-ng is under heavy development
there u r……; iftop
Bmon is a good choice..try vnstat also..namy options to configure to vnstat..
http://servertechz.com/linux/how-to-monitor-your-data-transfer-via-vnstat-network-traffic-monitor/