On server it’s useful to monitor, and collect, data about the use of your bandwidth, in the past I’ve wrote an article about “Monitor your bandwidth from the Linux shell” and I’ve also presented 4 useful tools that you can use to have a real time monitoring of the bandwidth:
IPTState : This software is a top-like interface to your netfilter connection-tracking table. Using iptstate you interactively watch where traffic crossing your netfilter/iptables firewall is going, sort by various criteria, limit the view by various criteria. But it doesn’t stop there: as of version 2.2.0 you can even delete states from the table!
pktstat displays a real-time list of active connections seen on a network interface, and how much bandwidth is being used. Partially decodes HTTP and FTP protocols to show what filename is being transferred. X11 application names are also shown.
NetHogs is a small ‘net top’ tool. Instead of breaking the traffic down per protocol or per subnet, like most tools do, it groups bandwidth by process. NetHogs does not rely on a special kernel module to be loaded. If there’s suddenly a lot of network traffic, you can fire up NetHogs and immediately see which PID is causing this. This makes it easy to indentify programs that have gone wild and are suddenly taking up your bandwidth.
IPTraf is a console-based network statistics utility for Linux. It gathers a variety of figures such as TCP connection packet and byte counts, interface statistics and activity indicators, TCP/UDP traffic breakdowns, and LAN station packet and byte counts.
They are all good I suggest to read my old articles to have a small introduction about them, today I want to show you vnstat, this small program has something more than the others, it can show real time statistics, but the feature that this small program shines it’s its ability to collect data over a long period of time.
vnStat is a console-based network traffic monitor for Linux and BSD that keeps a log of network traffic for the selected interface(s). It uses the network interface statistics provided by the kernel as information source. This means that vnStat won’t actually be sniffing any traffic and also ensures light use of system resources. In Linux at least a 2.2 series kernel is required, that should means that everyone should be able to use this small program.
The program is open source/GPL and can be used either as root or as a single user.
Installation
I’ve done my tests on a Debian server, for this distribution you can install the package available from the main repository simply with the command (as root):
apt-get install vnstat |
.
A package for this software should be present in all the repository of the main distributions, so you can probably install it with your package manager (pacman, yaourt, emerge, yum).
First setup
During the first run you have to introduce every interface that needs to be logged to vnStat. For example for a wired interface you have to use the command:
# vnstat -u -i eth0 |
Or a wireless interface:
# vnstat -u -i wlan0 |
When introducing an interface for the first time there will be an error message saying ‘unable to read database’. If this message is followed by an info message saying ‘a new database has been created’ the interface is successfully introduced. If this is not the case check that the specified interface is valid.
To see all the interfaces of your Linux system you can use the command
ip link show |
Note: I’ve tested this also on Ubuntu and at the end of the installation of vnstat I’ve got the message:
* Starting vnStat daemon vnstatd Zero database found, adding available interfaces... "eth0" added, 100 Mbit bandwidth limit. "wlan0" added, 100 Mbit bandwidth limit. -> 2 interfaces added. Limits can be modified using the configuration file. |
So if you see something like that you can skip the initialization of the interfaces and setting up an updating method.
Updating method
After introducing the interface(s) set one of the update methods.
Warning: Only use one of the methods, do not use them at the same time!
Cron
The first method is using Cron.Create /etc/cron.d/vnstat with the contents:
0-55/5 * * * * if [ -x /usr/bin/vnstat ] && [ `ls /var/lib/vnstat/ | wc -l` -ge 1 ]; then /usr/bin/vnstat -u; fi |
This assumes vnStat is installed in /usr/ and also assumes that /etc/cron.d is a location for system-run cron jobs (which is the default for most Linux distributions).
Service
The second way is using vnstatd a program that collect all the information and that is run as daemon, on debian you can start it with
#/etc/init.d/vnstat start |
If you use systemd you have to run the command:
# systemctl start vnstat.service |
Basic usage
The basic syntax it’s vnstat -i interfacename, on a system where you have just installed it, you should see something like this:
root@server:# vnstat -i venet0 Database updated: Sat Jul 6 08:48:26 2013 venet0 since 07/06/13 rx: 16 KiB tx: 26 KiB total: 42 KiB monthly rx | tx | total | avg. rate ------------------------+-------------+-------------+--------------- Jul '13 16 KiB | 26 KiB | 42 KiB | 0.00 kbit/s ------------------------+-------------+-------------+--------------- estimated -- | -- | -- | daily rx | tx | total | avg. rate ------------------------+-------------+-------------+--------------- today 16 KiB | 26 KiB | 42 KiB | 0.01 kbit/s ------------------------+-------------+-------------+--------------- estimated -- | -- | -- | |
Not so interesting perhaps ?
Well, when you have vnstat running for some time you get a LOT more information
$ vnstat -i eth1 Database updated: Sat Aug 1 22:50:01 2009 eth1 since 11/20/08 rx: 3.32 TiB tx: 2.81 TiB total: 6.13 TiB monthly rx | tx | total | avg. rate ------------------------+-------------+-------------+--------------- Jul '09 609.40 GiB | 282.21 GiB | 891.61 GiB | 2.79 Mbit/s Aug '09 16.95 GiB | 10.46 GiB | 27.40 GiB | 2.80 Mbit/s ------------------------+-------------+-------------+--------------- estimated 552.14 GiB | 340.70 GiB | 892.83 GiB | daily rx | tx | total | avg. rate ------------------------+-------------+-------------+--------------- yesterday 19.19 GiB | 8.63 GiB | 27.82 GiB | 2.70 Mbit/s today 16.95 GiB | 10.46 GiB | 27.40 GiB | 2.80 Mbit/s ------------------------+-------------+-------------+--------------- estimated 17.81 GiB | 10.99 GiB | 28.80 GiB | |
As you can see you have a small report that shows the total usage of bandwidth in real time (the first block) of this month and the previous, and the total bandwidth usage of today and yesterday, this is much more interesting for sure.
With the -h option you can get an hourly report of the last 24H.
root@server:# vnstat -h -i eth1
eth1                                                                     21:25
  ^           r
  |           r
  |           r                                            r
  |        r  r                                            r
  |      t r  r                                            r            t
  |     rt r  r                                            r  r      t  t
  |     rt r  r                                            r  r      t  t
  |     rt r  r         t                      r           r  r      t  t
  |     rt r  rt        t                   r  r        r  rt rt  t rt rt  t
  |  rt rt rt rt rt r  rt r              r  r  r  r  rt rt rt rt rt rt rt  t
 -+--------------------------------------------------------------------------->
  |  22 23 00 01 02 03 04 05 06 07 08 09 10 11 12 13 14 15 16 17 18 19 20 21

 h  rx (KiB)   tx (KiB)      h  rx (KiB)   tx (KiB)      h  rx (KiB)   tx (KiB)
22    250,801    205,825    06    100,529     49,054    14    205,356    157,877
23    705,144    885,844    07     52,806     44,130    15    258,228    226,265
00    928,792    224,789    08     52,298     45,230    16  1,028,043    343,843
01  1,271,180    292,260    09     70,396     61,719    17    755,804    293,309
02    212,296    186,481    10    155,502     72,451    18    235,691    284,886
03    165,931     91,943    11    266,673     92,497    19    275,554    658,386
04    150,997    437,071    12    392,244    122,185    20    307,819    850,813
05    180,170     56,391    13    133,829    120,555    21    117,474    292,787
Or if you just want to see the live stats you can use the -l option, statistics will be shown after interruption if the runtime was more than 10 seconds.
root@server:# vnstat -l -i eth0
Monitoring eth0...    (press CTRL-C to stop)

   rx:        0 kbit/s     1 p/s          tx:        4 kbit/s     2 p/s

 eth0  /  traffic statistics

                           rx         |       tx
--------------------------------------+------------------
  bytes                       21 KiB  |          36 KiB
--------------------------------------+------------------
          max              60 kbit/s  |       72 kbit/s
      average            3.36 kbit/s  |     5.76 kbit/s
          min               0 kbit/s  |        0 kbit/s
--------------------------------------+------------------
  packets                        262  |             272
--------------------------------------+------------------
          max                 94 p/s  |          94 p/s
      average                  5 p/s  |           5 p/s
          min                  0 p/s  |           0 p/s
--------------------------------------+------------------
  time                    50 seconds
Graphical output
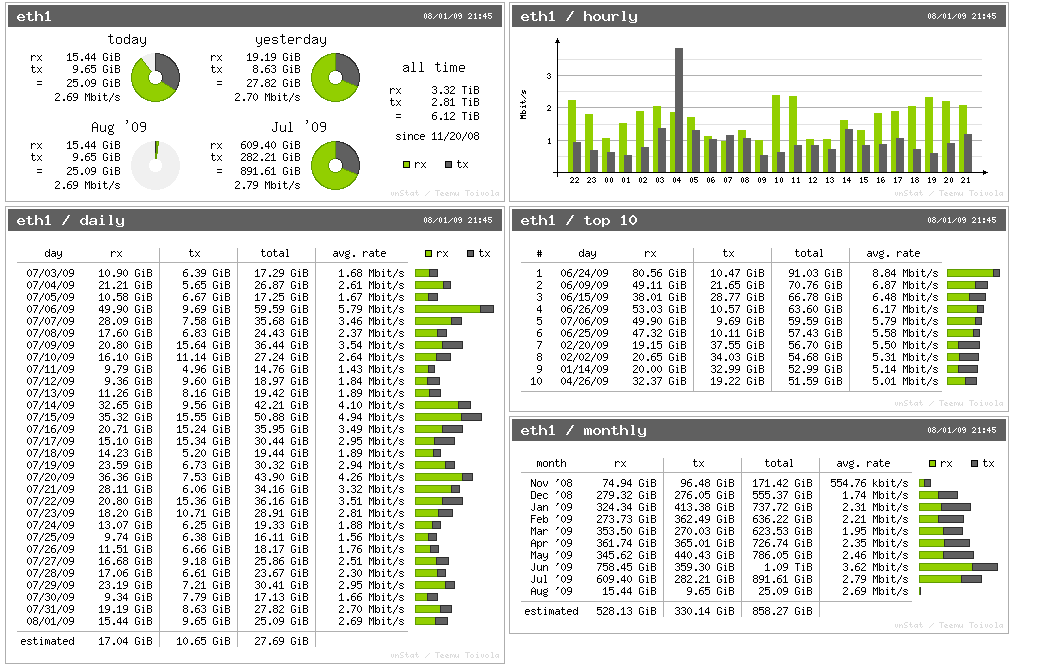
In the latest releases it’s present a new option to generate images.
You make the images with the command vnstati. From the link:
Description
The purpose of vnstati is to provide image output support for statistics collected using vnstat. The image file format is limited to png. All basic outputs of vnStat are supported excluding live traffic features. The image can be outputted either to a file or to standard output.
Examples
vnstati -s -i eth0 -o /tmp/vnstat.png
Output traffic summary for interface eth0 to file /tmp/vnstat.png.
vnstati -vs -i eth0+eth1+eth2 -o /tmp/vnstat.png
Output traffic summary with hourly data under the normal summary for a merge of interfaces eth0, eth1 and eth2 to file /tmp/vnstat.png.
This is an example of the images this command will produce:
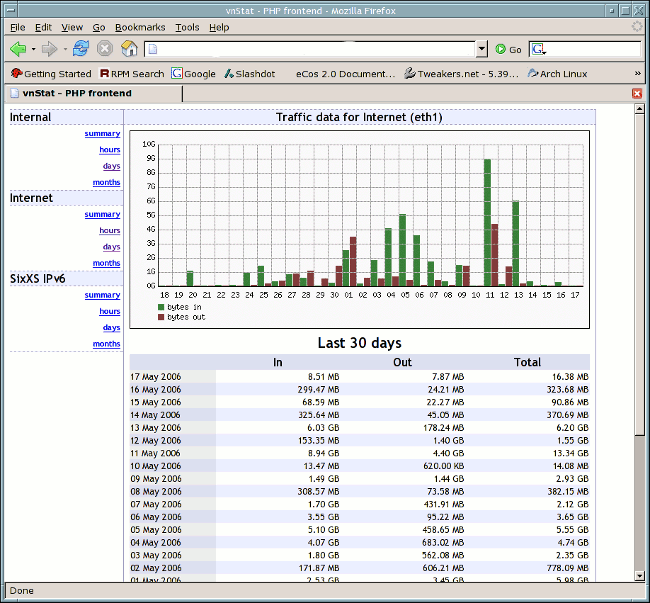
Or as alternative you can use a php frontend: vnstat PHP frontend, the script requires a working PHP setup with GD image libraries. Also vnStat must be properly installed and collecting data.
Popular Posts:
- None Found
![]()
Thank you Riccardo Capecchi for writing articles on CLI applications. Modern GUIs really have made me appreciate the visual simplicity of CLI apps while being direct and to the point.
I am using your articles to collect a list of CLI apps. I am writing/supporting a CLI app menu project because there is nothing to help newbies to know what CLI apps are out there. My project is currently at https://raw.github.com/rdchin/CLI-app-menu/stable/cli-app-menu.sh.
Keep writing and thanks!
I modified vnstat program to allow for adding initial value to the counter so that you can add the month’s usage prior to starting vnstatd in order to match with your ISP data counter. If anyone is interested let me know.
Is there anyway to differentiate traffic based on destination IP address?
For example, running vnstat on a server in your LAN. How would you differentiate WAN traffic when using eth0 for both purposes.