This is an article of mine, first published on Wazi
Every organization must monitor its infrastructure’s uptime and performance. While the popular Nagios application is a good general-purpose monitoring program that you can extend with plugins to handle just about any task, you may do even better by employing Cacti as a graphical front end to RRDTool‘s data logging and graphing functionality. Cacti was developed specifically to monitor and collect performance information, while Nagios is more oriented toward state changes, such as noting whether a daemon is up or down.
RRDTool stores all of the necessary information to create graphs and populate them with data in a MySQL database. Cacti provides templates to gather and show information such as system load (CPU, RAM, disks), users connected, MySQL load, and Apache load, all of which can affect the performance of your site.
Cacti’s front end is completely PHP-driven. It supports data gathering via different methods such as scripts in any language and SNMP.
Installation
To see how Cacti and RRDTool can help monitor devices on a network, we’ll use CentOS 6 as our server platform. To run properly, Cacti need a complete LAMP stack and RRDTool installed. Apache, PHP, and MySQL are available in the standard CentOS repository, while RRDTool is available in EPEL (Extra Packages for Enterprise Linux), a repository that holds useful packages for Red Hat Enterprise Linux-based distributions, including CentOS. If you don’t already have EPEL among your sources you can add it easily. If you are unsure about whether you have EPEL installed, run the command # rpm -qa |grep -i epel. If the output is a blank line, you probably don’t have it.
The command to add EPEL differs depending on your server’s CPU hardware architecture. To install it on a 32-bit system, run:
# rpm -ivh http://dl.fedoraproject.org/pub/epel/6/i386/epel-release-6-7.noarch.rpm
If you have a 64-bit system, run:
# rpm -ivh http://dl.fedoraproject.org/pub/epel/6/x86_64/epel-release-6-7.noarch.rpm
Then update the system with the command # yum update. Now you can use yum as root to install all of the necessary packages:
# yum -y install httpd
# chkconfig httpd on
# service httpd start

# yum -y install php php-mysql php-snmp php-xml

# yum install mysql mysql-server
# chkconfig mysqld on
# service mysqld start

# yum install -y rrdtool-php rrdtool

# yum install -y cacti net-snmp
The Cacti installation procedure adds a configuration file for Apache – namely /etc/httpd/conf.d/cacti.conf – so you have to restart Apache with the command:
# service httpd restart
Before you can use Cacti you must configure a MySQL database for it. Create the database with the command:
# mysqladmin --user=root create cacti
Import the default Cacti database from the projects doc directory:
# mysql cacti < /usr/share/doc/cacti-0.8.7i/cacti.sql
Though it’s optional, you should also create a MySQL username and password for Cacti. Here and below I’ve specified the username cactiuser, but you can use any name you like:
# mysql --user=root mysql
mysql> GRANT ALL ON cacti.* TO cactiuser@localhost IDENTIFIED BY 'somepassword';
mysql> flush privileges;
Now edit /usr/share/cacti/include/config.php and specify the database type, name, host, user, and password for your Cacti configuration.
$database_type = "mysql";
$database_default = "cacti";
$database_hostname = "localhost";
$database_username = "cactiuser";
$database_password = "cacti";
Next, set the appropriate permissions on Cacti’s directories for graph and log generation. Execute this command from inside Cacti’s directory to change the permissions:
# chown -R cactiuser rra/ log/
To have Cacti start gathering data, add a line to your /etc/crontab file similar to:
*/5 * * * * cactiuser php /usr/share/cacti/poller.php > /dev/null 2>&1
The Cacti application collects its data using a utility known as a poller. This line tells cron to use the standard poller and gather data every five minutes.
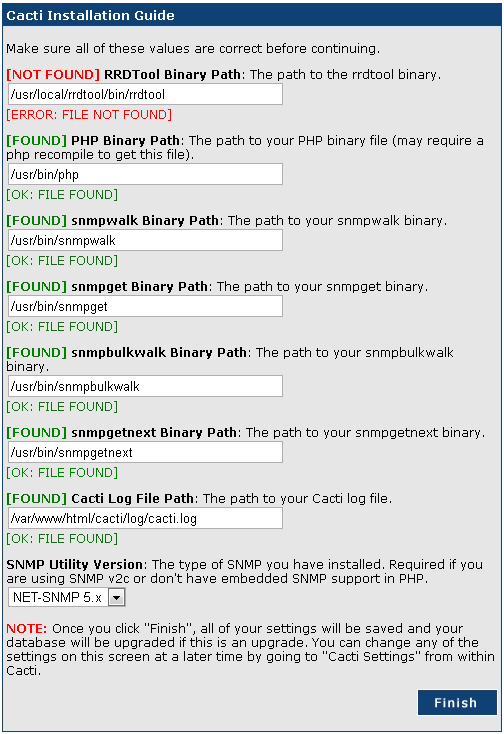
Now you can point your web browser to http://your-server/cacti/ to invoke a wizard that asks you if this is a new installation, and that verifies that all the variables and settings used by Cacti are correct (see figure below). Once it finishes successfully you can log into Cacti with a username and password of admin. You will be required to change this password immediately.

Note that during the installation you’ll be asked which versions of some packages are you using. To determine which versions of RRDTool and net-snmp are installed on your system, use the commands:
# rpm –qa net-snmp
# rpm –qa rrdtool
Cacti Configuration
Now you can work from the web interface to check graphs and add new devices to the Cacti installation. In Cacti, a device can be any hardware or software that can be monitored remotely or locally. Your local machine should already be listed, though when you first invoke Cacti no graphs may be ready, so wait a few minutes and check the graphs again. You should see information about your local machine, such as CPU usage and network traffic.
To add a network device, you have to know its IP address and SNMP credentials. In particular, for devices that use SNMPv2, you have to give the SNMP community. With the improved security in SNMPv3 you have to give more information.
Cacti has a set of data templates that define the structure for storing objects’ data, and that recognize the most common hardware; in practice, they use the MIB of the hardware. This kind of template is applied to specific hosts to create RRD files.
To add a new device follow these steps:
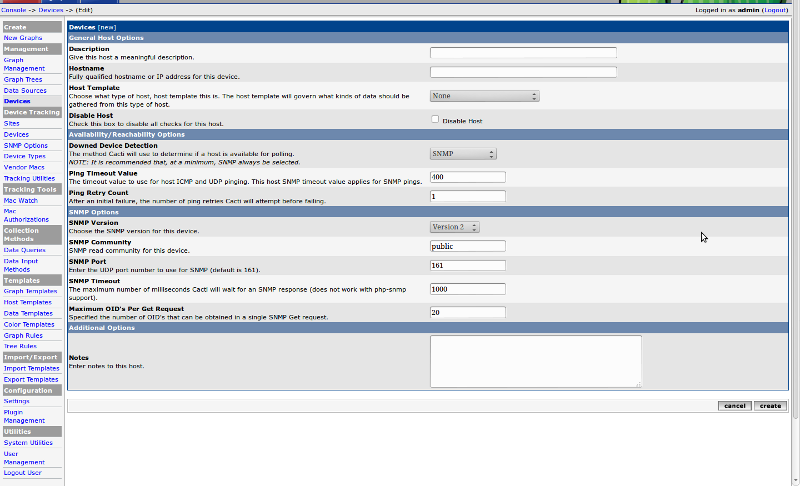
- Choose Add a device, and specify the name of the device, its IP address, and the SNMP information.

- After saving your new device, you should be redirected back to the same edit form with some additional information. If the SNMP connection is successful you will see in the new device screen the SNMP information in the top left.

- By default Cacti should have added the device’s SNMP Interface Statistics to the Associated Data Query. You can also verify the status of the SNMP Interface Statistics Data Query. It should say “Success” and show the number of items and rows. You can also click on Verbose Query to get raw SNMP data.
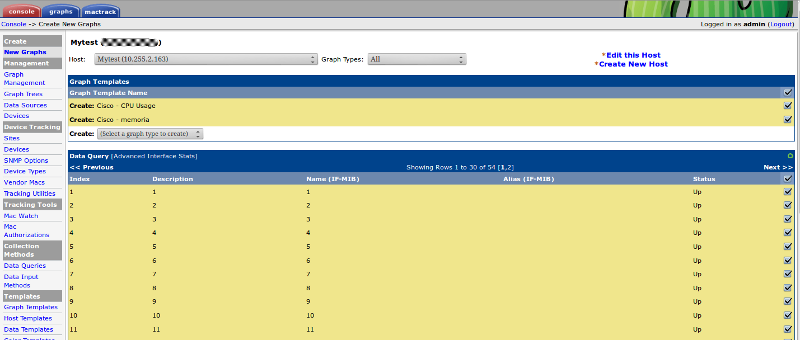
Cacti also uses graph templates, which are applied to specific hosts to create raw RRDTool graph statement. If you want to create a graph for a device, click on Create Graphs for this Host. Near the top of the screen, select the Graph Templates that represent basic information of the device that you are adding, and the interfaces you want to graph (see figure below). Select the appropriate Graph Type; if you have 10/100 interfaces, I suggest using In/Out bits with 95th Percentile, while for Gigabit Ethernet interfaces you can use In/Out bits (64-bit counters). You can’t graph VLAN interfaces, however, because they don’t report statistics properly. When you’ve chosen the settings you like, click Create.

After some time, once Cacti has collected enough data, you’ll see graphs similar to these:

You can in Cacti add all your network devices that have an SNMP daemon active, then create different graphs for each network device.
When you add a device you can optionally choose a host template for it. Host templates serve a different purpose than data and graph templates. Instead of abstracting the fields of a host, a host template allows you to associate graph templates and data queries with a given host type. In other words, a host template is a predefined set of graphs and/or data queries that can be assigned to devices. Using a host template for complex devices reduces the administrative task for adding devices; you can define an appropriate template once and assign it multiple times.
Best Practice
I hope you can see how simple Cacti makes it to get information on your network devices. It uses SNMP to get and store over time all the information on your network devices and their adapters. I use Cacti both to analyze data in real time, and more frequently to see the usage history of a particular network adapter. RRD can store information for a long time, so you can easily see if something in changing in your network.
While the network is Cacti’s usual target, you can also use Cacti to get information about Windows and Linux hosts. Just enable the SNMP protocol on any hosts you want to track and write your own host template, or download one from the project’s contribute page.
Cacti also has some plugins that extend the use of this software. I suggest trying Mactrack, which scans network devices and locates and automatically associates MAC addresses with their specific IP addresses. It also collects and stores network interface information, such as bandwidth utilization error counters, on all network switches.
Finally, if you want to get fancy, you can integrate Cacti with Nagios. For instance, you could use Cacti to store the performance information of all your network and host devices and use Nagios to check thresholds and send out notifications. In fact, the NPC plugin provides a complete web-based user interface replacement to Nagios while fully integrating into Cacti using the Cacti Plugin Architecture. It makes a great single point of access for trending and alert monitoring.
Popular Posts:
- None Found

Ciao sono nuovo, mi sto affacciando al mondo linux, più precisamente ad una macchina centos 7 sulla quale vorrei installare un sistema di monitoraggio, in passato (7 anni fa circa) ho usato la coppia nagios/nagvis, non male ma un pò macchinosa per l’implementazione di nuovi host.. Ora stavo leggendo di cacti che sembra una valida alternativa…
Sulla tua guida che sto cercando di seguire mi blocco qui:
# mysqladmin –user=root create cacti
ho questo errore:
mysqladmin: connect to server at ‘localhost’ failed
error: ‘Access denied for user ‘root’@’localhost’ (using password: NO)’
Tengo a precisare che alla macchina non ho fatto variazioni, installazione standard e installazione lamp… niente di più!
Grazie per l’aiuto