 One element that is often not know, or that should be measured after a problem statement or after a change in the infrastructure is the network . But how do you accurately measure the speed between two servers?
Someone use ftp, scp or other file transfer protocols, these can give some indication, but probably you’ll measure the limit of your disks or CPU.
In this article I will show you 3 way to measure the bandwidth from the command line, without using the disks.
Iperf
Iperf was developed by NLANR/DAST as a modern alternative for measuring maximum TCP and UDP bandwidth performance. Iperf allows the tuning of various parameters and UDP characteristics. Iperf reports bandwidth, delay jitter, datagram loss.
The quality of a link can be tested as follows:
– Latency (response time or RTT): can be measured with the Ping command.
– Jitter (latency variation): can be measured with an Iperf UDP test.
– Datagram loss: can be measured with an Iperf UDP test.
The bandwidth is measured through TCP tests.
To be clear, the difference between TCP (Transmission Control Protocol) and UDP (User Datagram Protocol) is that TCP use processes to check that the packets are correctly sent to the receiver whereas with UDP the packets are sent without any checks but with the advantage of being quicker than TCP.
Iperf uses the different capacities of TCP and UDP to provide statistics about network links.
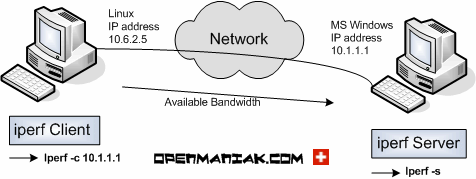
With Iperf you have a server machine where iperf put itself in listening and the other that is the client that send the informations.
Example:
Basic usage:
Server side:
#iperf -s ------------------------------------------------------------ Server listening on TCP port 5001 TCP window size: 8.00 KByte (default) ------------------------------------------------------------ [852] local 10.1.1.1 port 5001 connected with 10.6.2.5 port 54355 [ ID] Interval Transfer Bandwidth [852] 0.0-10.1 sec 1.15 MBytes 956 Kbits/sec ------------------------------------------------------------ Client connecting to 10.6.2.5, TCP port 5001 TCP window size: 8.00 KByte (default) ------------------------------------------------------------ [824] local 10.1.1.1 port 1646 connected with 10.6.2.5 port 5001 [ ID] Interval Transfer Bandwidth [824] 0.0-10.0 sec 73.3 MBytes 61.4 Mbits/sec |
Client side
#iperf -c 10.1.1.1 -d ------------------------------------------------------------ Server listening on TCP port 5001 TCP window size: 85.3 KByte (default) ------------------------------------------------------------ ------------------------------------------------------------ Client connecting to 10.1.1.1, TCP port 5001 TCP window size: 16.0 KByte (default) ------------------------------------------------------------ [ 5] local 10.6.2.5 port 60270 connected with 10.1.1.1 port 5001 [ 4] local 10.6.2.5 port 5001 connected with 10.1.1.1 port 2643 [ 4] 0.0-10.0 sec 76.3 MBytes 63.9 Mbits/sec [ 5] 0.0-10.1 sec 1.55 MBytes 1.29 Mbits/sec |
So using Iperf (with appropriate flags) on both our machines we can simply measure the bandwidth between them.
Iperf is available also for Windows.
Complete guide: http://openmaniak.com/iperf.php
Netcat
To eliminate the disks from having any part of the transfer, we will use netcat transferring the output of command yes. Netcat is described as being a “feature-rich network debugging and exploration tool”. It can be obtained from Source Forge, or it may already be available in your distribution.
Again we will use one of the machines as a server that receives the data and the other as a client that sends the information.
Basic usage
On th server machine
nc -v -v -l -n 2222 >/dev/null listening on [any] 2222 ... |
On the client machine
time yes|nc -v -v -n 10.1.1.1 2222 >/dev/null |
On client stop the process after 10 seconds (more or less) with ctrl-c, you’ll get something like:
sent 87478272, rcvd 0 real 0m9.993s user 0m2.075s sys 0m0.939s |
On the server machine, note the data received (in bytes)
sent 0, rcvd 87478392 |
Now multiply the bytes rcvd by 8 to get total bits, then divide by the time: Result in this example is 70Mb/s
Reference: http://deice.daug.net/netcat_speed.html
Bandwidth Test Controller (BWCTL)
BWCTL is a command line client application and a scheduling and policy daemon. These tests can measure maximum TCP bandwidth, with various tuning options available, or, by doing a UDP test, the delay, jitter, and datagram loss of a network.
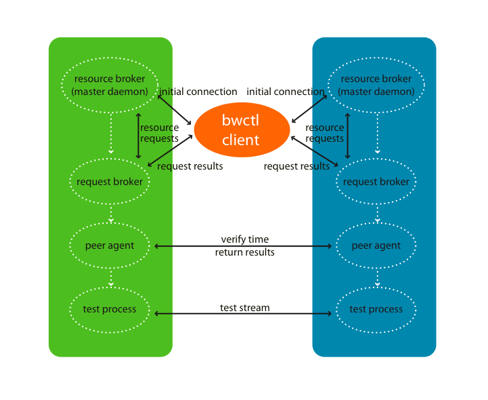
The bwctl client application works by contacting a bwctld process on the two test endpoint systems. BWCTL will work as a 3-party application. The client can arrange a test between two servers on two different systems. If the local system is intended to be one of the endpoints of the test, bwctl will detect whether a local bwctld is running and will handle the required server functionality if needed.
The bwctl client is used to request the type of throughput test wanted. Furthermore, it requests when the test should be executed. bwctld either responds with a tentative reservation or a test denied message. Once bwctl is able to get a matching reservation from both bwctld processes (one for each host involved in the test), it confirms the reservation. Then, the bwctld processes run the test and return the results. The results are returned to the client from both sides of the test. Additionally, the bwctld processes share the results from their respective sides of the test with each other.
For more information check the man page: http://www.internet2.edu/performance/bwctl/manpages.html
Popular Posts:
- None Found


c’è un problema con
nc -v -v -l -n 2222 > /dev/null
forse è più corretto
nc -v -v -l -n -p 2222 > /dev/null
ciao
Ciao ajkain
Su Ubuntu 10.10 io ho:
man nc
….
-p source_port
Specifies the source port nc should use, subject to privilege restrictions and
availability. It is an error to use this option in conjunction with the -l option.
….
Quindi il mio comando è volutamente senza -p, forse nella tua versione ci vuole.
Tu che versione di nc e distribuzione usi ?
Ciao
Don’t forget ‘ntool’.
Never used it.. do you have a link for this tool ?
Thanks !
To use ftp for network speed test but avoiding using disk :-
ftp remotehost
bin
put “|dd if=/dev/zero bs=32k count=10000” /dev/null
This will report the transfer time and avoids using disk at both ends
LOL.
A tiny tool that I’ve found very handy for diagnosing network problems is ttcp:
http://en.wikipedia.org/wiki/Ttcp
It’s trivial to build on just about any architecture with a C compiler,
speed-testing with iperf is a nice method.. As you can modify and alter the default operating system window size to test the speed..
http://www.slashroot.in/iperf-how-test-network-speedperformancebandwidth
“Now multiply the bytes rcvd by 8 to get total bits, then divide by the time: Result in this example is 70Mb/s”
According to http://myrepono.com/faq/4
Bandwidth should be calculated from bytes instead of bits, correct?
HI,
How i can monitor 1000’s of interfaces using iperf, is there any specific way to do that other than running client & server 1000 times for each interface.
Thanks,
Anki