As system administrator, or simple user that uses Linux on its desktop sometime you notice that something it’s eating all the memory of your system.
As first thing be sure to understand how Linux manage memory, I’ve be called too many time by scared users that did a free and were unable to read its output properly, in short, don’t worry if the Linux Kernel it’s using your memory to cache file.
< rant on >
To my “beloved” users:
Be assured that the Kernel developers can do a better job than you (and me) in find a good algorithm to cache file and free that memory area when a process need it, so please don’t ask me to put in cron some job that run something like that :
echo 3 > /proc/sys/vm/drop_caches |
After that you’ll have more free memory available on the system, true, but the system will have to re-read all the files from the disk, so in terms of performance this is usually a bad move.
< /rant >
But now let’s take a look at a nice small program that can help us in find which process/users are using, for real, the memory of our systems.
smem is a tool that can give numerous reports on memory usage on Linux systems. Unlike existing tools, smem can report proportional set size (PSS), which is a more meaningful representation of the amount of memory used by libraries and applications in a virtual memory system.
Because large portions of physical memory are typically shared among multiple applications, the standard measure of memory usage known as resident set size (RSS) will significantly overestimate memory usage. The parameter PSS instead measures each application’s “fair share” of each shared area to give a realistic measure.
smem has many features:
- system overview listing
- listings by process, mapping, user
- filtering by process, mapping, or user
- configurable columns from multiple data sources
- configurable output units and percentages
- configurable headers and totals
- reading live data from /proc
- reading data snapshots from directory mirrors or compressed tarballs
- lightweight capture tool for embedded systems
- built-in chart generation
Installation
If you use Debian, Ubuntu or Mint you can install smem directly from the official repository with the command:
$ sudo apt-get install smem |
Arch Linux users can install the package from the AUR repository.
Red Hat / Fedora / CentOS / SuSE users can use the pre-compiled binary that you can download directly from the official website, for your convenience you can copy and paste these commands that will put the command smem in your /usr/local/bin directory:
cd /tmp/ wget http://www.selenic.com/smem/download/smem-1.3.tar.gz tar xvf smem-1.3.tar.gz sudo cp /tmp/smem-1.3/smem /usr/local/bin/ sudo chmod +x /usr/local/bin/smem |
Basic Usage
smem reports physical memory usage, taking shared memory pages into account. Unshared memory is reported as the USS (Unique Set Size). Shared memory is divided evenly among the processes sharing that memory. The unshared memory (USS) plus a process’s proportion of shared memory is reported as the PSS (Proportional Set Size). The USS and PSS only include physical memory usage. They do not include memory that has been swapped out to disk.
The basic use will show the running processes with the amount of memory used, to see that run the command smem without any option, this will print an output similar to this one:
# smem PID User Command Swap USS PSS RSS .... 4223 linuxaria /usr/lib/chromium-browser/c 0 9144 11696 29132 14280 root python ./smem 0 11580 11839 13680 2180 linuxaria /usr/bin/python /usr/share/ 0 12956 14691 24392 2144 linuxaria python /usr/lib/linuxmint/m 0 20252 22337 35648 2121 linuxaria Thunar --daemon 0 13316 23122 44404 2123 linuxaria xfdesktop 0 24004 24924 36032 13095 linuxaria /usr/lib/chromium-browser/c 0 27536 30996 53328 2577 linuxaria /usr/bin/python /usr/lib/ub 0 34192 35112 41300 2127 linuxaria /home/riccio/copy/x86_64/Co 0 40268 41081 52248 10720 linuxaria /usr/lib/chromium-browser/c 0 38684 42107 63928 10561 linuxaria /usr/lib/chromium-browser/c 0 43956 48137 71644 10579 linuxaria /usr/lib/chromium-browser/c 0 46276 50290 73484 5605 linuxaria transmission-gtk /tmp/[kick 0 48616 51508 65148 8938 linuxaria /usr/lib/firefox/plugin-con 0 48960 55428 71132 2186 linuxaria /home/linuxaria/.dropbox-dist/ 0 55524 56061 64820 1722 root /usr/bin/X :0 -audit 0 -aut 0 52360 73110 96008 10623 linuxaria /usr/lib/chromium-browser/c 0 114224 121888 149236 4171 linuxaria chromium-browser --disable- 0 131044 140415 165780 7050 linuxaria /usr/lib/thunderbird/thunde 0 253428 256803 273152 2644 linuxaria /usr/lib/firefox/firefox 0 528420 537423 558992 |
So in this example (my desktop) the process that is eating more RAM is Firefox and at the second place Thunderbird.
An useful option it’s the -u that shows the sum of memory used per user:
#smem -u User Count Swap USS PSS RSS daemon 1 0 196 197 368 rtkit 1 0 300 312 1396 nobody 1 0 428 442 1600 mdm 2 0 600 695 1808 avahi 2 0 568 806 2420 syslog 1 0 1032 1043 1884 messagebus 1 0 1124 1207 2048 root 40 0 96568 123002 203372 linuxaria 83 0 1539864 1640378 2222556 |
It’s possible to add a -p to this command (and also with all the others) to show percentages values:
#smem -u -p User Count Swap USS PSS RSS daemon 1 0.00% 0.00% 0.00% 0.00% rtkit 1 0.00% 0.00% 0.00% 0.02% nobody 1 0.00% 0.01% 0.01% 0.02% mdm 2 0.00% 0.01% 0.01% 0.02% avahi 2 0.00% 0.01% 0.01% 0.03% syslog 1 0.00% 0.01% 0.01% 0.02% messagebus 1 0.00% 0.01% 0.01% 0.03% root 40 0.00% 1.18% 1.47% 2.41% linuxaria 83 0.00% 19.29% 20.48% 27.58% |
Or if you prefer a system wide memory usage view, you can use -w
#smem -w -p Area Used Cache Noncache firmware/hardware 0.00% 0.00% 0.00% kernel image 0.00% 0.00% 0.00% kernel dynamic memory 64.55% 62.42% 2.13% userspace memory 22.12% 3.00% 19.12% free memory 13.33% 13.33% 0.00% |
With the -w I suggest to use also the option -R REALMEM, this value it’s the amount of physical RAM. This lets smem detect the amount of memory used by firmware/hardware in the systemwide (-w) output. If provided, it will also be used as the total memory size to base percentages on.
#smem -R 8G -w -p Area Used Cache Noncache firmware/hardware 2.83% 0.00% 2.83% kernel image 0.00% 0.00% 0.00% kernel dynamic memory 63.02% 60.95% 2.07% userspace memory 21.60% 2.91% 18.68% free memory 12.56% 12.56% 0.00% |
Making graphs of the linux memory with smem
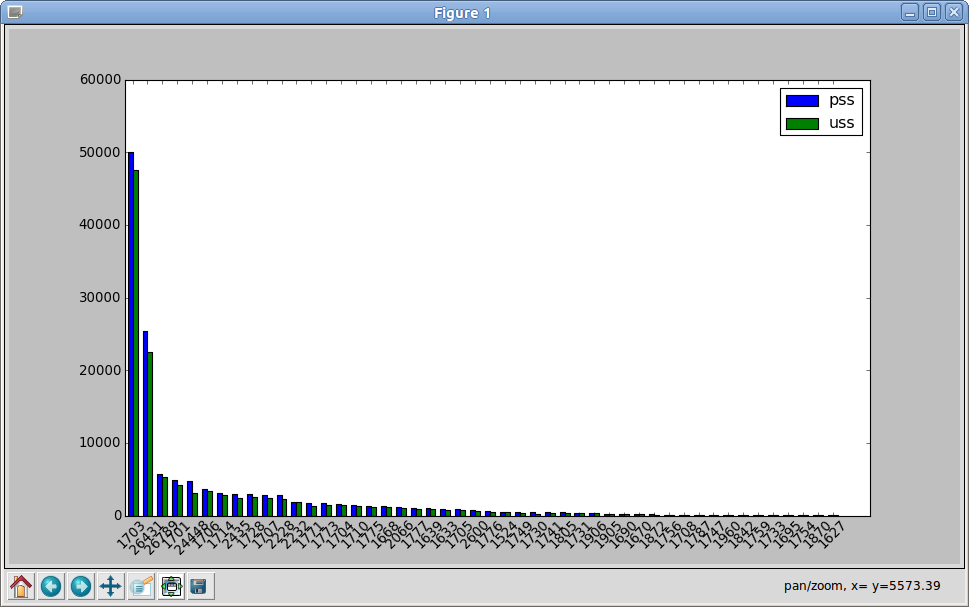
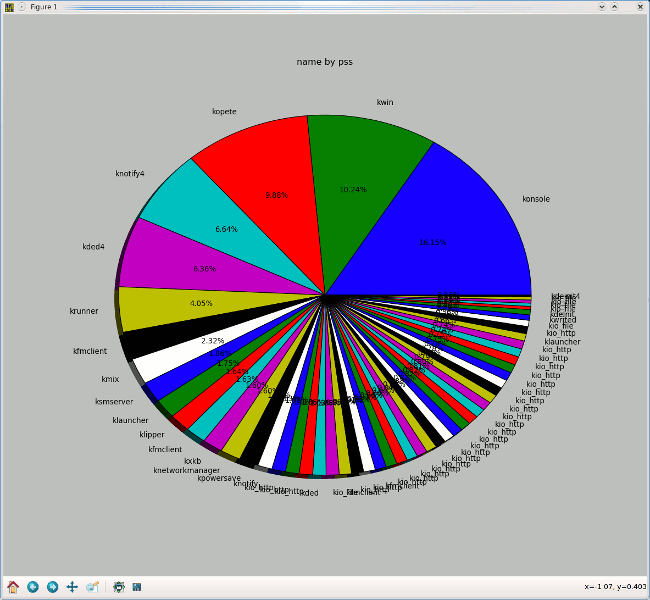
With smem (and having the matplotlib library) it’s possible to generate bar and pie chart with just some more options:
Show a bar graph with the columns “pss and uss”:
#smem --bar pid -c "pss uss" |
Creates a pie chart of the processes that start with ‘k’ on a running system:
#smem -P '^k' --pie=name |
Conclusions
Smem it’s an easy to use tool that can give with ease some useful information when searching for memory hoggers, it’s also simple to get a graph of them, so you’ll be able to talk with your users and persuade them that after all their process are not so small and well done, memory wise.
Popular Posts:
- None Found


A dure il vero in Arch Linux il programma è nel repository “community”; per installarlo basta quindi un semplice “pacman -S smem”
Ciao
Grazie mille Alberto, su Arch sono ancora molto niubbo 🙂
A quick sudo yum search smem shows that it is in the repos for Fedora 19.
================================================ N/S matched: smem ================================================
smem.noarch : Report application memory usage in a meaningful way
Cheers!
Thanks for the feedback, I don’t have a fedora to test the repository.
Be aware of a name conflict. There is a utility that is part of secure-delete which may cause a problem if you have it installed. That utility was formerly known as ‘sdmem’ but was renamed to ‘smem’. The manpage explains the name change this way: “This utility was originally called sdmem but was renamed for debian to avoid name clashes with another package.”
This is a delight!
Well more to learn I guess…. thanks a lot