Most of this post is based on the information found in the blog of Nicolargo, the author of this tool.
Glances is a free software (licensed under LGPL) to monitor your GNU/Linux or BSD operating system from a text interface. Glances uses the library libstatgrab to retrieve information from your system and it is developed in Python.
So another top/htop clone ?
Yes and no, an unique thing about glances that I’ve immediately seen is that you can configure thresholds in its configuration file and see the status of your system resources with colors that indicates if everything is fine or not, at a glance.
Installation
Glances is available for some distributions: Debian (SID), Arch, Fedora, Redhat, FreeBSD but not for Ubuntu or Mint (for what I’ve found at least) so to install the latest version (1.6 at the moment) my suggestion is to use PyPi, an official Python package manager.
$ sudo apt-get update $ sudo apt-get install python-pip build-essential python-dev |
Then install the latest Glances version:
$ sudo pip install Glances Downloading/unpacking Glances Downloading glances-1.6.tar.gz (674Kb): 674Kb downloaded Running setup.py egg_info for package Glances Downloading/unpacking psutil>=0.4.1 (from Glances) Downloading psutil-0.6.1.tar.gz (138Kb): 138Kb downloaded Running setup.py egg_info for package psutil Installing collected packages: Glances, psutil Running setup.py install for Glances Installing glances script to /usr/local/bin Running setup.py install for psutil building '_psutil_linux' extension gcc -pthread -fno-strict-aliasing -DNDEBUG -g -fwrapv -O2 -Wall -Wstrict-prototypes -fPIC -I/usr/include/python2.7 -c psutil/_psutil_linux.c -o build/temp.linux-x86_64-2.7/psutil/_psutil_linux.o gcc -pthread -shared -Wl,-O1 -Wl,-Bsymbolic-functions -Wl,-Bsymbolic-functions -Wl,-z,relro build/temp.linux-x86_64-2.7/psutil/_psutil_linux.o -o build/lib.linux-x86_64-2.7/_psutil_linux.so building '_psutil_posix' extension gcc -pthread -fno-strict-aliasing -DNDEBUG -g -fwrapv -O2 -Wall -Wstrict-prototypes -fPIC -I/usr/include/python2.7 -c psutil/_psutil_posix.c -o build/temp.linux-x86_64-2.7/psutil/_psutil_posix.o gcc -pthread -shared -Wl,-O1 -Wl,-Bsymbolic-functions -Wl,-Bsymbolic-functions -Wl,-z,relro build/temp.linux-x86_64-2.7/psutil/_psutil_posix.o -o build/lib.linux-x86_64-2.7/_psutil_posix.so Successfully installed Glances psutil Cleaning up... |
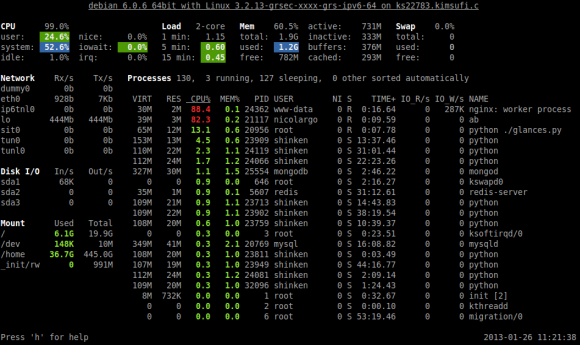
Now you can test it typing in a terminal: glances, you should see some similar to this output:
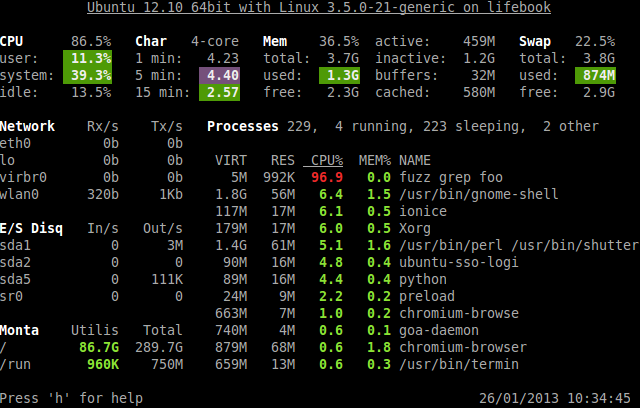
In glances you’ll see a lot of information about the resources of your system: CPU, Load, Memory, Swap Network, Disk I/O and Processes all in one page, by default the color code means:
- GREEN : the statistic is “OK”
- BLUE : the statistic is “CAREFUL” (to watch)
- VIOLET : the statistic is “WARNING” (alert)
- RED : the statistic is “CRITICAL” (critical)
When Glances is running, you can press some special keys to give commands to it:
a Sort processes automatically this means that:
- if CPU IoWait > 60% sort by process “IO read and write”
- If CPU > 70%, sort by process “CPU consumption”
- If MEM > 70%, sort by process “memory size”
c Sort processes by CPU%
m Sort processes by MEM%
p Sort processes by name
i Sort processes by IO Rate
d Show/hide disk I/O stats
f Show/hide file system stats
n Show/hide network stats
s Show/hide sensors stats
b Bit/s or Byte/s for network IO
w Delete warning logs
x Delete warning and critical logs
1 Global CPU or Per Core stats
h Show/hide this help message
q Quit (Esc and Ctrl-C also work)
l Show/hide log messages
Configuration file
You can set your thresholds in Glances configuration file, on GNU/Linux, the default configuration file is located in /etc/glances/glances.conf.
Note that if you have installed the package via PyPy you’ll not have that directory or the file, so you can start downloading the file https://gist.github.com/4647457, this is a good template that you can modify to put your values.
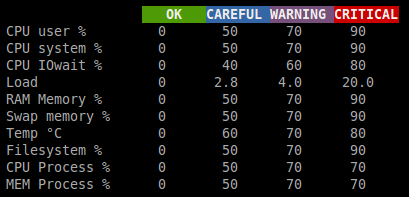
As you can see in the file is defined a section for each statistics (CPU, LOAD, MEM …) type Careful limits (to monitor), Warning (to treat), Critical (to be treated in an emergency).
The Limits used are available in the help window in the form of a table.
Client/server mode
Another interesting feature of this monitoring tool is that you can start it in server mode just typing glances -s, this will give an output like Glances server is running on 0.0.0.0:61209 and now you can connect to it from another computer using glances -c @server where @server is the IP address or hostname of the server.
Glances uses a XML/RPC server and can be used by another client software.
In server mode, you can set the bind address (-B ADDRESS) and listening TCP port (-p PORT), the default binding address is 0.0.0.0 (Glances will listen on all the networks interfaces) and TCP port is 61209.
In client mode, you can set the TCP port of the server (-p port).
In client/server mode, limits are set by the server side.
The version 1.6 introduces a optional password to access to the server (-P password) that if set on the server must be used also on the client.
Conclusions
Glances is really an interesting project, it adds to the tools similar to top the concept of threshold, that can be useful when you manage a large quantity of servers and want to setup different views (perhaps is normal that your DB server uses 95% of the CPU, but it’s not fine if this is done by the web server), and also the concept of client/server, this open new opportunity like having a central point that collects all the info from your server, or build a web frontend that parses these data and put them in some nice web-pages.
Some suggestions ? Add a Thread view for processes, and the possibility to run it via cron jobs that produces an output in a file (csv,xml or just text, like nmon)
Popular Posts:
- None Found
![]()
Goodness, Text?. I thought we were trying to move away from this old school stuff. Slap a simple, intuitive GUI on that sucker and call it a day.
Who is trying to move away from terminal ?
Not servers for sure 🙂
Looks like a cross between top and topas (AIX)