This is a re-post of the original article byJason Skowronski, Amy Echeverri and Sadequl Hussain first posted on http://www.loggly.com
Linux Logging Basics
First we’ll describe the basics of what Linux logs are, where to find them, and how they get created. If you already know this stuff, feel free to skip to the next section.
Linux System Logs
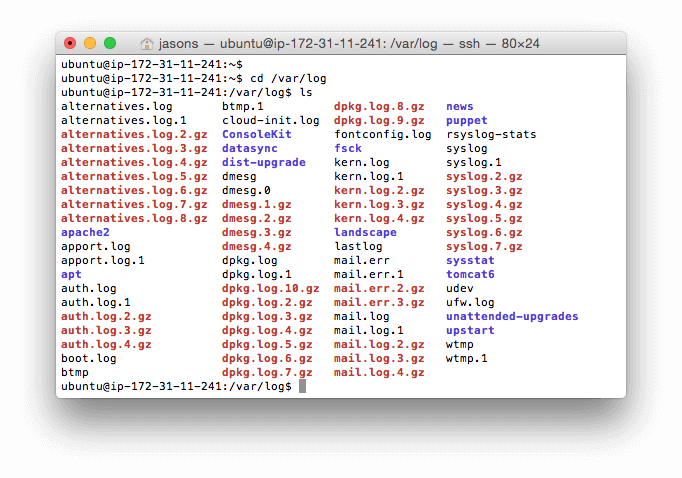
Many valuable log files are automatically created for you by Linux. You can find them in your /var/log directory. Here is what this directory looks like on a typical Ubuntu system:
Some of the most important Linux system logs include:
- /var/log/syslog or /var/log/messages stores all global system activity data, including startup messages. Debian-based systems like Ubuntu store this in /var/log/syslog. RedHat-based systems like RHEL or CentOS store this in /var/log/messages.
- /var/log/auth.log or /var/log/secure stores logs from the Pluggable Authentication Module (pam) including successful logins, failed login attempts, and authentication methods. Ubuntu and Debian store authentication messages in /var/log/auth.log. RedHat and CentOS store this data in /var/log/secure.
- /var/log/kern stores kernel error and warning data, which is particularly helpful for troubleshooting custom kernels.
- /var/log/cron stores information about cron jobs. Use this data to verify that your cron jobs are running successfully.
What’s Syslog?
How do Linux system log files get created? The answer is through the syslog daemon, which listens for log messages on the syslog socket /dev/log and then writes them to the appropriate log file.
The word “syslog” is an overloaded term and is often used in short to refer to one of these:
- Syslog daemon — a program to receive, process, and send syslog messages. It can send syslog remotely to a centralized server or write it to a local file. Common examples include rsyslogd and syslog-ng. In this usage, people will often say “sending to syslog.”
- Syslog protocol — a transport protocol specifying how logs can be sent over a network and a data format definition for syslog messages (below). It’s officially defined in RFC-5424. The standard ports are 514 for plaintext logs and 6514 for encrypted logs. In this usage, people will often say “sending over syslog.”
- Syslog messages — log messages or events in the syslog format, which includes a header with several standard fields. In this usage, people will often say “sending syslog.”
Syslog messages or events include a header with several standard fields, making analysis and routing easier. They include the timestamp, the name of the application, the classification or location in the system where the message originates, and the priority of the issue.
Here is an example log message with the syslog header included. It’s from the sshd daemon, which controls remote logins to the system. This message describes a failed login attempt:
1 2003-10-11T22:14:15.003Z server1.com sshd - - pam_unix(sshd:auth): authentication failure; logname= uid=0 euid=0 tty=ssh ruser= rhost=10.0.2.2
Syslog Format and Fields
Each syslog message includes a header with fields. Fields are structured data that makes it easier to analyze and route the events. Here is the format we used to generate the above syslog example. You can match each value to a specific field name.
<%pri%>%protocol-version% %timestamp:::date-rfc3339% %HOSTNAME% %app-name% %procid% %msgid% %msg%n
Below, you’ll find descriptions of some of the most commonly used syslog fields when searching or troubleshooting issues.
Timestamp
The timestamp field (2003-10-11T22:14:15.003Z in the example) indicates the time and date that the message was generated on the system sending the message. That time can be different from when another system receives the message. The example timestamp breaks down like this:
- 2003-10-11 is the year, month, and day.
- T is a required element of the TIMESTAMP field, separating the date and the time.
- 22:14:15.003 is the 24-hour format of the time, including the number of milliseconds (003) into the next second.
- Z is an optional element, indicating UTC time. Instead of Z, the example could have included an offset, such as -08:00, which indicates that the time is offset from UTC by 8 hours, PST.
Hostname
The hostname field (server1.com in the example above) indicates the name of the host or system that sent the message.
App-Name
The app-name field (sshd:auth in the example) indicates the name of the application that sent the message.
Priority
The priority field or pri for short ( in the example above) tells you how urgent or severe the event is. It’s a combination of two numerical fields: the facility and the severity. The severity ranges from the number 7 for debug events all the way to 0 which is an emergency. The facility describes which process created the event. It ranges from 0 for kernel messages to 23 for local application use.
Pri can be output in two ways. The first is as a single number prival which is calculated as the facility field value multiplied by 8, then the result is added to the severity field value: (facility)(8) + (severity). The second is pri-text which will output in the string format “facility.severity.” The latter format can often be easier to read and search but takes up more storage space.
Popular Posts:
- None Found
![]()