Dstat is a versatile replacement for vmstat, iostat, netstat and ifstat. Dstat overcomes some of their limitations and adds some extra features, more counters and flexibility. Dstat is handy for monitoring systems during performance tuning tests, benchmarks or troubleshooting.
Dstat allows you to view all of your system resources in real-time, you can eg. compare disk utilization in combination with interrupts from your IDE controller, or compare the network bandwidth numbers directly with the disk throughput (in the same interval).
Dstat gives you detailed selective information in columns and clearly indicates in what magnitude and unit the output is displayed. Less confusion, less mistakes. And most importantly, it makes it very easy to write plugins to collect your own counters and extend in ways you never expected.
Dstat’s output by default is designed for being interpreted by humans in real-time, however you can export details to CSV output to a file to be imported later into Gnumeric or Excel to generate graphs.
Features
- Combines vmstat, iostat, ifstat, netstat information and more
- Shows stats in exactly the same timeframe
- Enable/order counters as they make most sense during analysis/troubleshooting
- Modular design
- Written in python so easily extendable for the task at hand
- Easy to extend, add your own counters (please contribute those)
- Includes many external plugins to show how easy it is to add counters
- Can summarize grouped block/network devices and give total numbers
- Can show interrupts per device
- Very accurate timeframes, no timeshifts when system is stressed
- Shows exact units and limits conversion mistakes
- Indicate different units with different colors
- Show intermediate results when delay > 1
- Allows to export CSV output, which can be imported in Gnumeric and Excel to make graphs
Installation
Ubuntu/Mint and Debian:
The package it’s available on the repository, so you can easily install it with the command:
# sudo apt-get install dstat |
RHEL/Centos and Fedora:
The package it’s available in the rpmforge repository, so you can add it, see this guide, and after that install it easily with the command:
# yum install dstat |
ArchLinux:
The package it’s available in the community repository, so it can be easily installed with the command:
# pacman -S dstat |
Usage
The basic usage of dstat it’s just the command dstat that produces an output like this one:
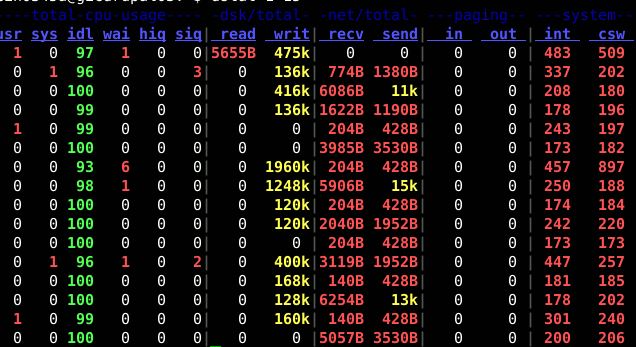
The default will show you these information:
CPU stats: What percentage of the CPU is in use. The more interesting sections of this report are user, system, and idle, which should break down most of the current CPU use. If you see high CPU use in the “wait” column there might be a problem elsewhere in the system. When a cpu “waits” it’s because it’s expecting a response from an I/O device (like memory, disk, or network) and hasn’t received it yet.
Disk stats: Read and write activity to disks, this is the total for all of your disks.
Net stats: Data sent and received on network devices, this is the total of all of your network devices.
Paging stats: Paging activity on the system. Paging refers to a memory management technique used behind the scenes on your system. A high level of paging can indicate that the system is using a lot of swap space, or it could mean that memory is very fragmented, in general you want to see 0 0 for pages/in page/out.
System stats: This shows interrupts (int) and context switches (csw). These stats are usually only useful if you have a baseline to compare them to. Higher stats in these columns usually indicate a large number of processes jostling for the CPU’s attention. Since your server is likely running many processes by default, there will always be some numbers there.
By default dstat reports new figures every second. To quit dstat you can use “control-C”.
Note that the first line of the report is typically going to show nothing for all stats.
That’s because dstat operates by summarizing what it saw since its last report. When it first runs there’s no data to average or sum.
It’s possible to control the delay between reports and the number of reports dstat will output in a run by passing 2 options. As example if you want dstat to run with default stats, wait 3 seconds between reports, and only report 10 results, you could run:
dstat 3 10 |
In dstat there are a lot of options, you can see all with the command man dstat, some of the most useful parameters are:
- -l = shows load statistics
- -m = shows the memory usage (used, buffer, cache, free)
- -r = displays I/O statistics,
- -s = shows the swap usage
- -t = puts the current time in the first column
- –fs = displays file system stats (includes amount of files and used inodes)
- –nocolor = sometimes very useful…
- –socket = shows interesting network statistics
- –tcp = displays common TCP stats
- –udp = shows you the listen and active figures for the UDP usage
And that’s not all, dstat ships with a number of plugins that extend its capabilities greatly. It’s possible to check the directory /usr/share/dstat in order to view a list of them. Some of the most useful are:
- –disk-util = shows how much the disks are busy at the moment
- –freespace = shows the current disk usage
- –proc-count = displays the number of running processes
- –top-bio = points to the most expensive block I/O process
- –top-cpu = draws the attention on the most expensive CPU process
- –top-io = shows the most expensive “normal” I/O process
- –top-mem = displays the process using the most memory
Some examples:
To see who is eating all the memory:
dstat -g -l -m -s --top-mem |
To shows some stats about the CPU resource consumption:
dstat -c -y -l --proc-count --top-cpu |
How to send to a csv file
To send the output to a csv file for later use we can issue the following command:
- # dstat –output /tmp/sampleoutput.csv -cdn
Popular Posts:
- None Found
![]()