I’m usually for the old school methods: go down to the terminal and get all the information you need from there, terminal don’t tells lies.
But i also understand that with the cheap price that i see around for the VPS more people are starting to use Linux VPS for their service, and a graphical dashboard can be really useful for many VPS owner.
In a former article i’ve wrote about 4 software that can help you in the management of your Linux server, today we’ll see a simple tool that can be used to know via your browser the status to all of your servers.
The software it’s Status2K
Status2k System Requirements
The software it’s php based, and encoded with Ioncube, it can be run on both Linux and windows servers, these are the requirements:
General Requirements
ionCube (Status2k is packaged with the latest IonCube Loader files).
GD & TrueType Fonts (Required for dynamic images & graphs).
CURL (Not required but recommended for faster multiserver fetching).
PHP 4.3.2+ (Status2k is fully compatible with PHP 5.0+).
MySQL 4.0+ (Currently no other database system is supported).
Linux Requirements
Open Base_Dir = Disabled.
Shell_Exec = Enabled.
Windows Requirement
Windows XP, 2000, 2003, 2008. WMI = Enabled.
If you are not sure that the script will run on your server please download our checker file from: http://www.status2k.com/checker.zip
Installation
I’ve got a demo package from Ian, the leader of this project, but the steps with the official package are the same.
You’ll get a zip file containing all the software, you just need to:
- Decompress the Status2k archive to a local directory on your system.
- Copy the config-sample.php to config.php and check the database settings are correct.
- Upload all the files contained in this archive to a web accessible directory on your server or hosting account.
- Run the /install/ directory e.g. http://www.yourdomain.com/status/install/ and follow the instructions.
- Remove or rename the /install directory.
- Setup the cron.php file to run every few minutes using a cron job.

The dashboard
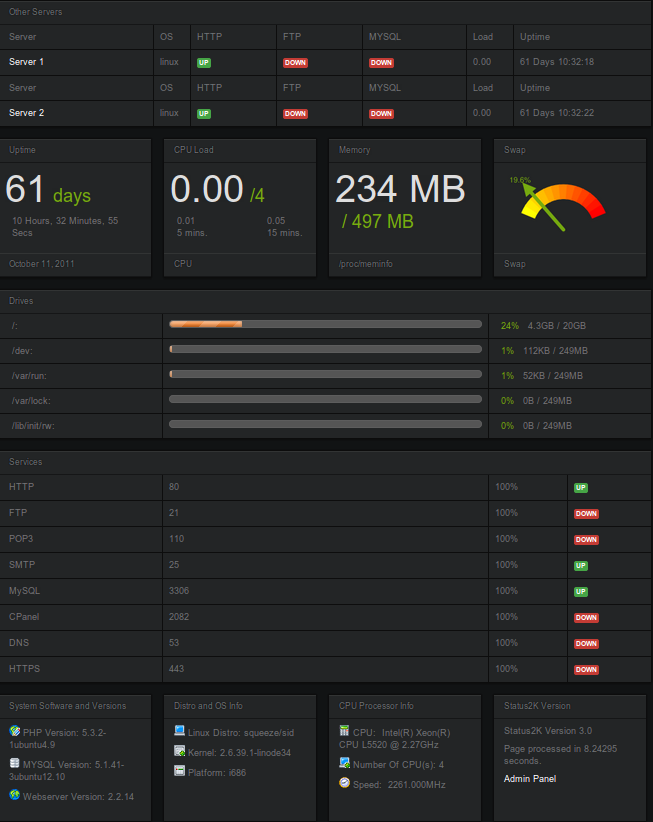
In the dashboard you have an overview of the main statistics of your server: Uptime, Cpu used, Memory and Swap.
After these information you can see an overview of all the filesystems of the server and than an overview of the status of all the services that you have defined for that server (Http, Mysql, ftp, etc.).
And at last on the bottom of the page you’ll get some information on the hardware and software version of that server.
What i’ve not told is that in the upper part of the dashboard you have a short summary of your otehr servers, where you can see in a glance if they have some services not running, for details just click on the server name and you’ll get the detailed dashboard for that server.
That’s the public Dashboard, that you could also show to your customers if you are a reseller, or just to show how your server is working.
In teh admin area (password protected) there are also useful information:
Live admin area (AJAX) displays Load, Memory, Swap, Ports/Services, Users in SSH & Connection Stats.
Admin Logs Access, Suexec, DMESG, Error & Custom Logs.
Bandwidth monitoring both incoming and outgoing data.
Load, Memory, Swap & Bandwidth graphs.
Price
The software costs 30$ for lifetime license, and if you have more than a server ?
No problem, you only pay for one licence to cover all your servers.
Conclusions
As told, in general i’m for the command line to do anything, but i see great possibility with this small tool, if you have multiple servers this could give a quick status of the global situation in a glance, without much effort for the setup and for 30 $, that is nothing for what you get.
Another tool to consider for the management of Linux (and if you really want) windows servers.
Popular Posts:
- None Found

I buy script 5 day ago but status2k.com not sent me script, they not answering my emails.
Then sent me a password but it also not working.