 If in your work you are responsible for just one server, you will surely wonder: What is the best way to get the situation under control?
In the world there are good open source software that allow you to monitor the status of servers, services and programs.
In this article we’ll see an overview some of the software in this category, and in particular some related to Nagios
Nagios

In my view any product in this category must deal with Nagios, this project was born in 1996 and over time has established itself as one of the best open source monitoring projects.
The project is divided into Nagios Core and and the paid version with support Nagios XI that has some additional features.
Nagios Core is the monitoring and alerting engine that serves as the primary application around which hundreds of Nagios projects are built. It serves as the basic event scheduler, event processor, and alert manager for elements that are monitored. It features several APIs that are used to extend its capabilities to perform additional tasks, is implemented as a daemon written in C for performance reasons, and is designed to run natively on Linux/*nix systems.
Nagios XI extends on proven, enterprise-class Open Source components to deliver the best monitoring solution.
Features
- Monitoring of network services (SMTP, POP3, HTTP, NNTP, ICMP, SNMP, FTP, SSH)
- Monitoring of host resources (processor load, disk usage, system logs) on a majority of network operating systems, including Microsoft Windows with the NSClient++ plugin or Check_MK.
- Monitoring of anything else like probes (temperature, alarms…) which have the ability to send collected data via a network to specifically written plugins
- Monitoring via remotely-run scripts via Nagios Remote Plugin Executor
- Remote monitoring supported through SSH or SSL encrypted tunnels.
- Simple plugin design that allows users to easily develop their own service checks depending on needs, by using the tools of choice (shell scripts, C++, Perl, Ruby, Python, PHP, C#, etc.)
- Plugins available for graphing of data (Nagiosgraph, PNP4Nagios, and others available)
- Parallelized service checks available
- Ability to define network host hierarchy using “parent” hosts, allowing detection of and distinction between hosts that are down and those that are unreachable
- Contact notifications when service or host problems occur and get resolved (via e-mail, pager, SMS, or any user-defined method through plugin system)
- Ability to define event handlers to be run during service or host events for proactive problem resolution
- Automatic log file rotation
- Support for implementing redundant monitoring hosts
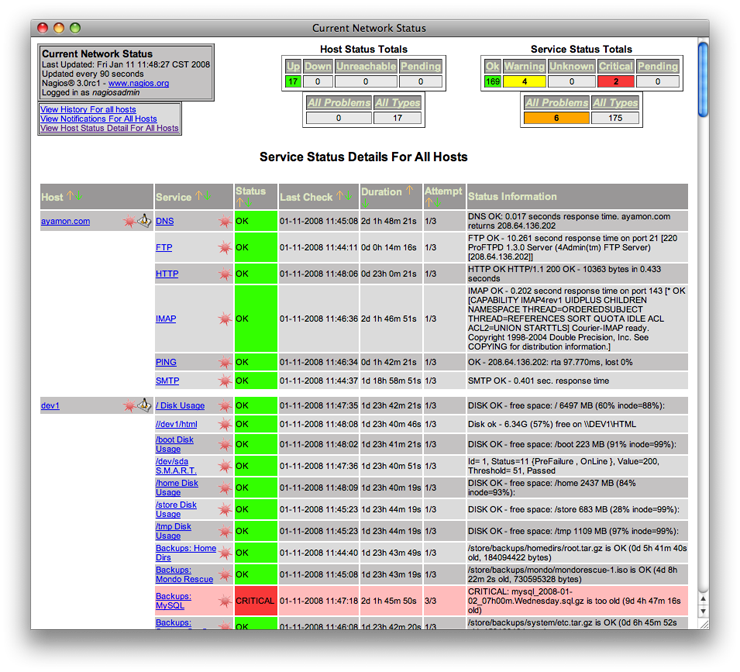
- Optional web-interface for viewing current network status, notifications, problem history, log files, etc.
If you are looking for a new monitoring software, Nagios is definitely the starting point for me; I appreciate it for its scalability, ease with which you can build your custom plugins and the huge community that develops new plugins or addons.
A demo is available at this url: http://demos.nagios.com/
Icinga
Icinga is a fork of Nagios and is backward compatible. So, Nagios configurations, plugins and addons can all be used with Icinga. Though Icinga retains all the existing features of its predecessor, it builds on them to add many long awaited patches and features requested by the user community.
Being a fairly new Nagios fork in Icing you’ll find all the features mentioned above, then what are the differences between the two?
At the moment the 2 main difference are:
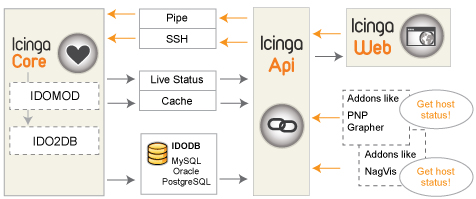
1) Web interface – being written from scratch the Icinga interface look similar to the old Nagios web interface but add some interesting options, like dashboards and some commands extended to all service that you are viewing.
2) API – While addons in Nagios communicate with the core through various ways. For addons like PNP and Grapher, this is through performance data from the core, while NagVis receives data direct from the NDO database. Therefore when developers write addons for Nagios, they need to consider the best method of interacting with the core. In the case of writing addons for Icinga however, thanks to the in-built API developers need only to write with the API in mind. In effect the API does the work of “translating” different output formats for the developer. For example, the user sends a command in the web interface which is sent to the API.
A demo of icinga is available at this address.
Opsview
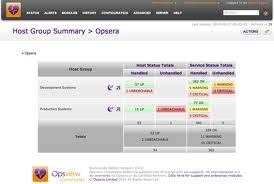
Opsview it’s a product “derivated” from Nagios, it’s use the Nagios core as engine for check and notification, some open source addon for Nagios and a custom Web interface. Opsview it’s available in 2 formats Opsview Community ed Opsview Enterprise.
As usual the community release it’s totally released under open source and it’s the testing platform for the Enterprise, that add official support and some proprietary module to the infrastructure.
Some of the enteprise modules are:
Reports
Brings report generation and automation capabilities to Opsview Enterprise.
Service Desk Connector
Integrates Opsview Enterprise edition with your service desk providing automated incident generation, reducing the delay between fault and response.
SMS Messaging
Sends SMS alerts direct from Opsview Enterprise, removing the dependency on your IT infrastructure and ensuring staff are notified of critical issues.
RANCID
Monitor your network device configuration, back-up your settings to a central location, track changes and generate alerts in Opsview Enterprise when changes occur.
A demo is available after registration at this url: http://www.opsview.com/products/online-demo
Or you can test a Virtual appliance with all already configured:
Virtual appliance
This virtual appliance version of Opsview Community on Ubuntu Server (32-bit) is designed to get you up and running as quickly as possible. You’ll need to download and configure the free VMware Player. You can also use VMware Server / ESX if you use the VMware Converter tool first.
Popular Posts:
- None Found

How does OpenNMS not make it onto this list? All of the packages listed are Nagios or derivatives thereof.
What about Zabbix? It’s great system to imho!
To be true the next 2 open source monitoing programs that i want to check are Zenoss and Zabbix. I’ve never used OpenNMS but i’ll try that too.
Thanks
moved from groundworks nagios to zenoss. Zenoss is da best//
What about Shinken ?
http://www.shinken-monitoring.org/
Bye
To be true i never heard of it.
I’ve took a quick look at the site, the project is fairly new and with nice features.
But you’ll put the core of monitoring of your data center to a product that is at his 0.5 release with a fast deploy release cycle ?
I think i’ll wait al least for version 1.0 and check it in 1 year or so.
Thanks for the link.
Shinken is due out in version 1.2 this summer. The team is making a case for less pain from a configuration standpoint and to simplify the typical deployments.
There is a lot of goodness being prepared and lots of efforts have been done to increase stability and performance.
I got involved in the project and I think it does have a lot of promise in making monitoring suck just a bit less.
I hope you get a chance to look it over.
Thanks for the info, I’m interested in this software and if I’ve some time I’d like to test the new version of Shinken.
Some time ago I written my own script for server monitoring. All it does is ping a host (up to 3 times), if the host doesn’t respond it send out an sms with info about that the host is offline to the specified list of phone numbers. Sms is sent via a usb connected mobile phone (to be safe in case the monitoring machine goes offline). I had it running in my previous workplace on a laptop connected to an additional UPS so even if the company had a power failure – the sms notifications would be sent for a good couple of hour.
Project page: http://sourceforge.net/projects/ckpingtestsms/ (mostly in Polish, I plan to translate the app into English in the next few months.)
Thanks for the info, it could be a minimal system to check the uptime of some servers.
And connecting to a sms “gateway” it’s for sure a good idea.
complimenti per la sintetica panoramica,
a distanza di un anno quale è stata l’evoluzione dei tre sistemi proposti?
dal punto di vista di personalizzazione dell’interfaccia utente come sono i tre prodotti?
Esiste del materiale per organizzare una presentazione del lavoro che hai fatto
in occasione del prossimo LinuxDay?
Paolo Foletto
Ciao Paolo,
Grazie per i complimenti.
Sul mercato dei prodotti di monitoraggio c’e’ in effetti fermento ed in un anno stanno cambiando un po le cose, magari è buono per un nuovo articolo, diciamo che è apparso Shinken (http://www.shinken-monitoring.org/) nato con l’idea di monitoring distribuito, molto ben fatto e compatibile con il padre di tutti i prodotti open source: nagios.
Icinga si sta comportando molto bene ed è molto interessante per le sue API, maniene bene la posizione Nagios, anche se personalmente non condivido alcune scelte del padre del progetto.
Per quanto riguarda il Linux day, penso che si possa fare una presentazione generale del “monitoring open source” con una panoramica sui principali prodotti disponibili, se vuoi contattami ad [email protected] e ne “parliamo”.
Ciao