 In a previous article about 2 programs that you can use to collect network statistics: iptstate and pktstat, on the article I’ve received comments on nethogs and iptraf, and so I’ve tested them.
The goal of both applications is to give to the user information of the actual state of the network, so how much bandwidth is used and which process are using it. Another thing these two programs have in common is that they are text-based programs that you can use within the terminal, so you can use them at home on your desktop or on a server at work.
nethogs
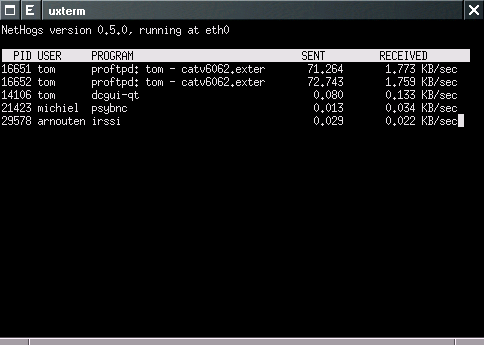
NetHogs is a small ‘net top’ tool. Instead of breaking the traffic down per protocol or per subnet, like most tools do, it groups bandwidth by process. NetHogs does not rely on a special kernel module to be loaded. If there’s suddenly a lot of network traffic, you can fire up NetHogs and immediately see which PID is causing this. This makes it easy to indentify programs that have gone wild and are suddenly taking up your bandwidth.
Installation
NetHogs version 0.7.0 it’s available in Ubuntu repository so from your terminal use the usual:
sudo aptitude install nethogs |
Basic usage
The command must be run as root, so you can choose between become root with a sudo -i or run the command with a sudo in front of it.
nethogs [-V] [-d seconds] [device [device ]] |
Where -V will print the version and -d is delay for update refresh rate in seconds. default is 1,
device is the name of your network card, for me is eth1 (my wireless, eth0 it’s my ethernet).
To check the name of your interfaces you can use the command
ip link ls up |
The lo is the loopback a virtual device, so one of the others device that you see it’s your active device, check for the one with the flag “state UP”
A typical output is (i was downloading with flezilla a big file):
NetHogs version 0.7.0 PID USER PROGRAM DEV SENT RECEIVED 4796 linuxaria filezilla eth1 7.979 364.146 KB/sec 4649 linuxaria /usr/bin/pidgin eth1 0.041 0.030 KB/sec 5046 linuxaria /usr/bin/pidgin eth1 0.000 0.000 KB/sec 3575 linuxaria ../lib/thunderbird-3.1.10b! eth1 0.000 0.000 KB/sec 3131 linuxaria /usr/bin/pidgin eth1 0.000 0.000 KB/sec 4726 linuxaria /usr/bin/pidgin eth1 0.000 0.000 KB/sec 3333 linuxaria /usr/lib/chromium-browser/c eth1 0.000 0.000 KB/sec 0 root unknown TCP 0.000 0.000 KB/sec TOTAL 8.020 364.176 KB/sec |
iptraf
IPTraf is a console-based network statistics utility for Linux. It gathers a variety of figures such as TCP connection packet and byte counts, interface statistics and activity indicators, TCP/UDP traffic breakdowns, and LAN station packet and byte counts.
Installation
Iptraf version 3.0 it’s available in Ubuntu repository so from your terminal use the usual:
sudo aptitude install iptraf |
Iptraf it’s also available for redhat, debian, fedora and suse.

Basic usage
Like nethogs also iptraf needs root privileges to work properly. In a terminal run iptraf
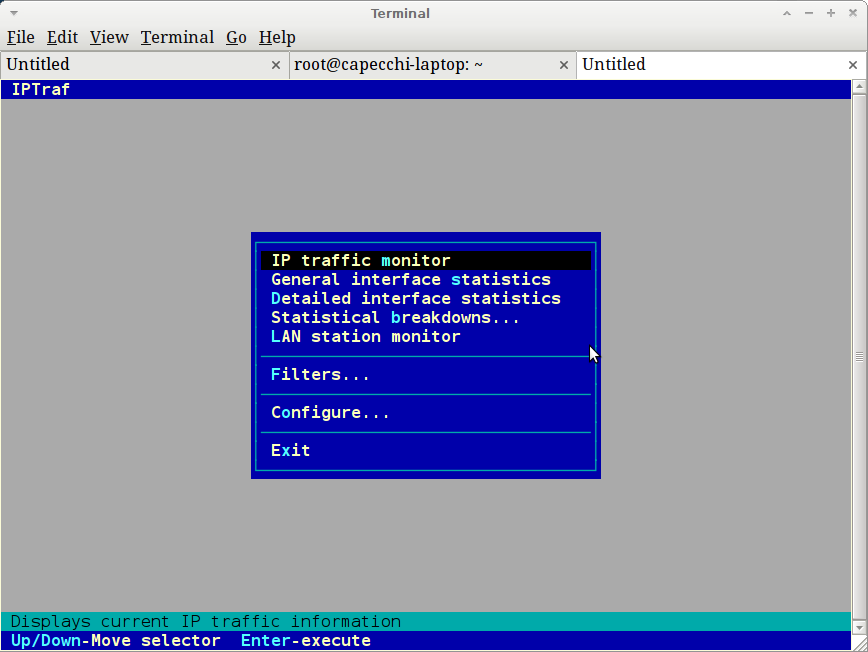
, you’ll be presented with a first screen with versions informations and license, hit return to go in the main menu of iptraf. From here you can just start up a traffic capture or you can set some options and/or filters you can gather general or detailed interface statistics, or you can gather statistics on a LAN station.
Moving around in the menu it’s easy and in few moments you’ll see all the options available in this powerful tool.
Conclusions
Both tools are powerful and give different informations, probably for a first diagnostic nethogs it’s much better and immediate to use, while iptraf, also if the development of this tool is stopped and last release it’s dated 2005, gives much more informations useful for a network specialist and/or server administrators.
Popular Posts:
- None Found

I’ve never used nethogs, but I will check it out. I have used iptraf for years, but my absolute favorite utility is iftop. It’s like top, but for the network. (URI to the utility’s site supplied in the URI field)
iptraf doesnt work with Fedora 15. It looked perfect but Fed15 has changed interface names to em1 (embedded 1) instead of eth0. And iptraf will not see it.
Thanks for the feedback, i don’t use fedora from some time so i don’t test the software on it.
Best regards
anche se l’articolo è vecchio mi è stato di grande utilità, ti chiedo una dritta, esiste qualcosa simile a nethogs che però mi dia il rate di upload e download su tutte le macchine presenti in una rete? giusto per poter capire quale macchina sta scaricando o uplodando di più..grazie mille
Ciao,
Per una macchina singola puoi usare vnstat: http://linuxaria.com/recensioni/monitot-your-bandwidth-on-linux-with-vnstat?lang=en
Ha il pregio di tenere lo storico.
Per una soluzione più distribuita, ovvero punto centrale di raccolta delle informazioni ti suggerisco di guardare Cacti.
Un saluto