Even this year I was in Bolzano (Italy) for the annual conference organized by Wuerth-Phoenix on Monitoring with Open Source products.
I found the conference very interesting, with speakers from around the world that have described several open source products and best practices on monitoring but also on configuration and management tools. A big surprise for me has been the strong push for alternatives softwares to Nagios for monitoring in particular Shinken and Icinga have received many praise.
But before I give some more details about the presentations a few words about the company that has hosted about 400 people in their, free of charge, event, Wuerth-Phoenix manufactures and markets an appliance called NetEye, within there are many Open source products including:
Nagios Core, with many preinstalled plugins, Cacti, ocsinventory, GLPI, NfSen, Nedi, and DocuWiki the highest level version has also OTRS, all these software are integrated with some web management interface developed by Wuerth-Phoenix itself.
After the greetings from the organizers the speakers have started with their talks, the slides are already online (compliments!) So if some description of the talks seem interesting, you can take an in-depth on the subjects with the original slides.
These are the talks that have impressed me more:
First talk:
Olivier Jan, Founder of the French Monitoring Community (F)
One of the most interesting talks in my opinion, Olivier has presented the tools that he thought might be the future of monitoring, the first consideration is that the cloud is increasing exponentially the number of hosts and services to monitor which thus requires a scalable monitoring solution, he sees two possible solutions for this problem:
Icinga installed with Mod_gearman an event broker (this also works with Nagios) that allow to scale horizontally the number of servers running the check, while maintaining a single central server management.
Or an alternative software created to make this task: Shinken, this software is born a few years ago with the idea to make a monitoring solution compatible with the cloud, with distinct elements that can be replicated and multiply, and so is possible to raise the number of checks really easily and without any loss in performance.
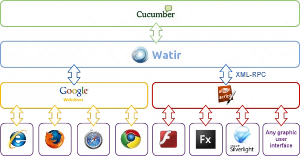
After that Olivier has talked about monitoring the end user experience, so not just the state of single ICT servers but browsing a complete website and check some outputs, the suggested tools for this tasks are:
Cucumber
Watir Webdriver
Sikuli
I never heard of these software, so I must definitely study them, thanks Olivier.
Another interesting aspect of his talk has been regarding the managment of the logs, for this task Olivier suggest 2 tools:
This is a tool for managing events and logs. You can use it to collect logs, parse them, and store them for later use (like, for searching). Speaking of searching, logstash comes with a web interface for searching and drilling into all of your logs.
Some of the features are:
- Various inputs (AMQP, Syslog, TCP, XMPP, file, Twitter…)
- Filters and rewrites (date, grep, gelfify, grok…)
- Various outputs (AMQP, websockets, Nagios, XMPP, MongoDB…)
- Can act as a collection daemon, transport agent as well as a pre or post log filter
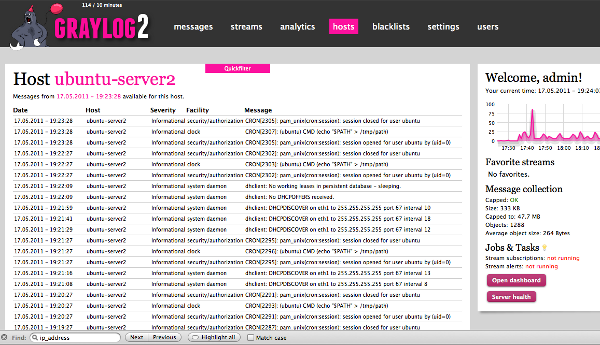
2 graylog2
Graylog2 is an open source log management solution that stores your logs in ElasticSearch. It consists of a server written in Java that accepts your syslog messages via TCP, UDP or AMQP and stores it in the database. The second part is a web interface that allows you to manage the log messages from your web browser.
Features:
- Syslog daemon with extended possibilities (AMQP, GELF…)
- Web interface to interact in real-time with logs
- Elastic Search backend
- MongoDB for prefs
- Streams
- Blacklists
- Alerts (mail, Nagios)
These are some of the things i liked more but Olivier has talked also of other interesting software, check his slides for more info.
Second talk
Jeffrey Hammond, Principal Analyst Forrester Research (US)
Before the start I was thinking that a talk from an analyst would be really boring…i could not be more wrong !
Jeffrey has illustrated some interesting information on the adoption of Open source on big company, tracing in the 2009 the year when OS has “crossed the chasm”, becoming the most important part of the software in most of the biggest company.
A number that i remember is that 80% of the company use OS software in some of their phases (development, testing, desktop, server, etc.)
After this first information he has applied his analyst experience on evaluating some open source monitoring tools, taking in counts things like: number of developers, number of commit per month, how the code is commented, user rating and other aspects.
He has presented these information for the most famous monitoring software tools, and to make it short:
OS monitoring software on the raise: Cacti, Shinkend and Icinga
OS monitoring software going down : Zenoss, Hyperic HQ and Groundwork
As usual check his slides for more information.
Third talk:
Bernd Erk, Managing Director NETWAYS GmbH (GER)
This has been another great talk with the presentation of many interesting Open source software, the only bad thing for Bernd is that some of the software were also present in the first talk of the day.
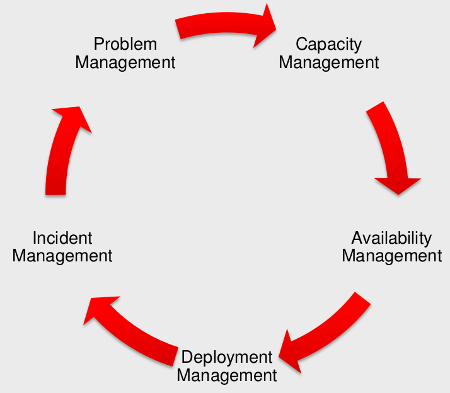
Erk has presented the software starting from the ITIL Lifecycle, so presenting different Open Source software for any phase:
This is the list of software suggested for every phase:
Capacity Management – Tools
Independent Tools
- Cacti
- Munin
- Graphite
• Nagios/Icinga Addons
- PNP4Nagios
- inGraph
Of these i want to take a look at ingraph a software developed by netways.org
Availability Management – Tools
Business Process addon for icinga/Nagios
Deployment Management Tool
Puppet
Incident Management Tool
Request Tracker by BestPractical
Problem management Tools
- Jasper
- Pentaho
- Birt
Personally I must say that these 3 were the presentations that impressed me the most, perhaps because i knew very well some of the things in other talks, or I’ve already seen them in other events.
I advise you to look also at the slides of the talks:
Luca Deri, Founder ntop (I)
Getting more Information on your Network Performance
Talk where he presented the new tools for the Deep Packet Inspection (DPI) developed by him and his team and integrated into an appliance that can be used to monitor application-level flows used by users of a network.
Jimmy Conner, Cacti Plugin Architecture (US)
10 Year of Cacti – The latest Evolution of the new Plugins
In this talk Jimmy has presented the status for the Cacti project and some of the most commonly used plugins.
Michael Schwartzkopff, Consultant for high availability systems and network management (SWI)
Network Discovery with NeDi
A speech dedicated to the product NEDI, an open source software that can do the scan of the whole network, gather information about our equipment and report changes in the state of the network.
Conclusions
It’s been a great event, my compliments to all the speakers and to Wuerth-Phoenix for the organization, there were around 400 people following the talks, and I’ve enjoyed talking with them at the lunch, i hope to see you next year.
Popular Posts:
- None Found


