 Those who work with Linux servers, but also those who use Linux as a desktop every day knows that it is very useful to have a list of processes running on the machine with a list of resources they are using, to see who is eating all the memory or is using all the CPU, and the ps command is not exactly the most convenient. So we ‘ll see a series of programs that serve to show what’s happening in our system and who is using our resources.
The first tool that you can use to get information is the ps command, yes i know, it’s not so handy but you are sure to have it installed in every machine and you can get quickly some information on the system:
Get the top 10 CPU consuming process
ps aux | sort -n -k 3 | tail -10
Get the top 10 memory consuming process
ps aux | sort -n -k 4 | tail -10
Top
In most Unix-like operating systems, the top command is a system monitor tool that produces a frequently-updated list of processes. By default, the processes are ordered by percentage of CPU usage, with only the “top” CPU consumers shown. The top command shows how much processing power and memory are being used, as well as other information about the running processes. Some versions of top allow extensive customization of the display, such as choice of columns or sorting method.
The top command is useful for system administrators, as it shows which users and processes are consuming the most system resources at any given time.
Starting from the first line, from left to right, we see the command name, the system time and the amount of time since the system was booted. Moving on, we can see how many users are currently running processes in the system, and then the average of processes waiting to run split in three time periods: 1, 5 and 15 minutes. The next row displays info about system tasks and their state.
CPU information awaits on the next row, starting with current load, then showing how much of it is used by system, nice (low priority), iddle, and awaiting processes. The next two rows display memory information.
After that you’ll see a changing list of system process ordered (as default) by their cpu consuming
Some useful command:
k – Allows you to “kill” a process providing his pid
r – This allows you to renice a process providing his pid
u – This will display only the processes of a user
F – Select sort field
Simply type “q” to quit the top command and return to the system prompt.

HTOP
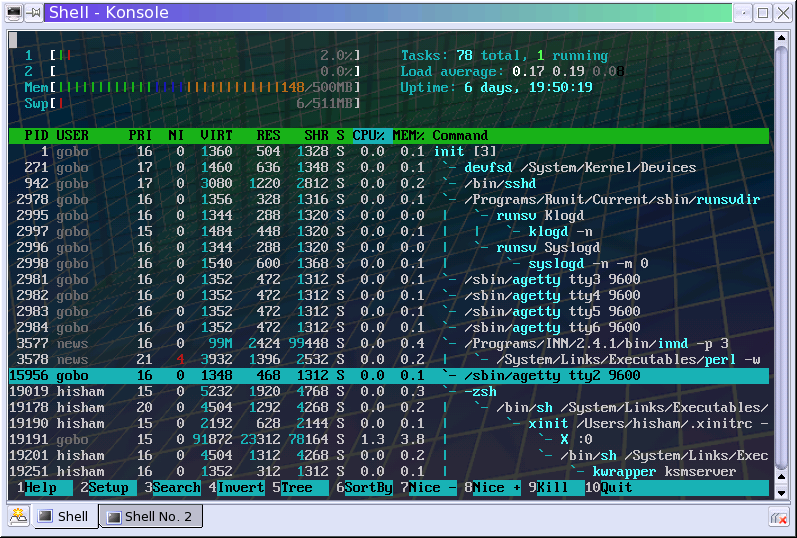
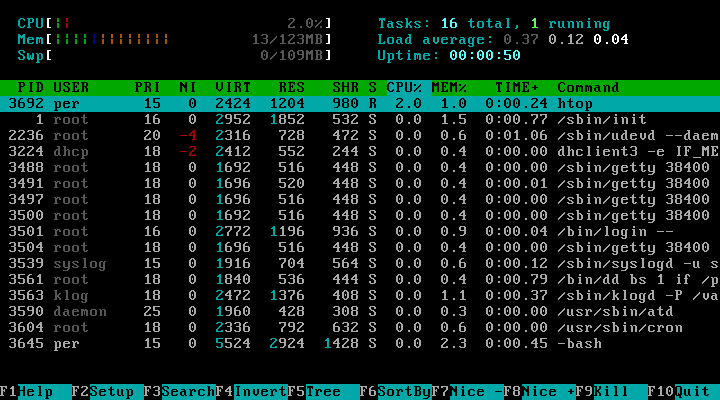
Htop is an interactive system-monitor process-viewer written for Linux. It is designed to replace the Unix program top. It shows a frequently updated list of the processes running on a computer, normally ordered by the amount of CPU usage. Unlike ‘top’, Htop provides a full list of processes running, instead of the top resource-consuming processes. Htop uses color and gives visual information about processor, swap and memory status.
Users often deploy htop in cases where Unix top does not provide enough information about the systems processes, for example when trying to find minor memory leaks in applications. Compared to top, it provides a more convenient, cursor-controlled interface for killing processes.
Some useful command:
Arrow keys – move around and select a process
F6 – Choose “sort by”
F7 – Remove priority to selected process (renice)
F8 – Add priority to selected process
F9 – Kill the select process
Comparison between htop and top
- In ‘htop’ you can scroll the list vertically and horizontally to see all processes and complete command lines.
- In ‘top’ you are subject to a delay for each unassigned key you press (especially annoying when multi-key escape sequences are triggered by accident).
- ‘htop’ starts faster (‘top’ seems to collect data for a while before displaying anything).
- In ‘htop’ you don’t need to type the process number to kill a process, in ‘top’ you do.
- In ‘htop’ you don’t need to type the process number or the priority value to renice a process, in ‘top’ you do.
- ‘htop’ supports mouse operation, ‘top’ doesn’t
- ‘top’ is older, hence, more used and tested.
Gnome system Monitor
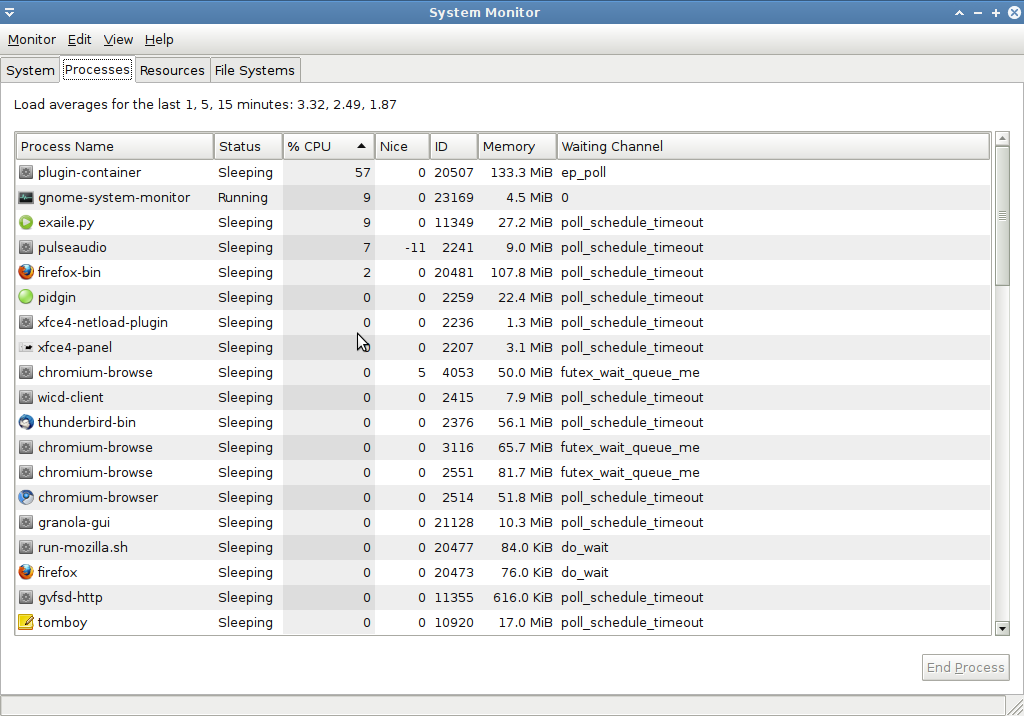
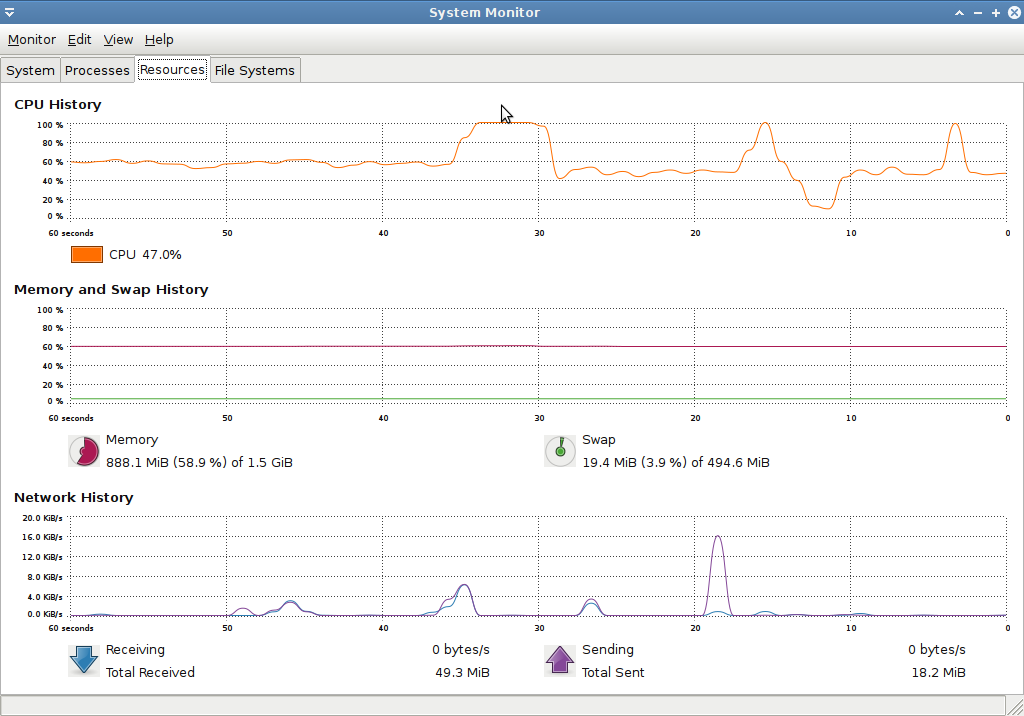
Gnome System Monitor is a GNOME process viewer and system monitor with a nice easy-to-use interface, It has some nice features, such as a tree view for process dependencies, icons for processes, the ability to hide processes that you don’t want to see, graphical time histories of CPU/memory/swap usage, the ability to kill/renice processes needing root access, as well as the standard features that you might expect from a process viewer.
Popular Posts:
- None Found


[…] System Monitor su Linux In un precedente articolo abbiamo visto come utilizzare un terminale per verificare lo stato di un processo o le risorse […]
[…] Htop – 终端下的系统监视器 […]